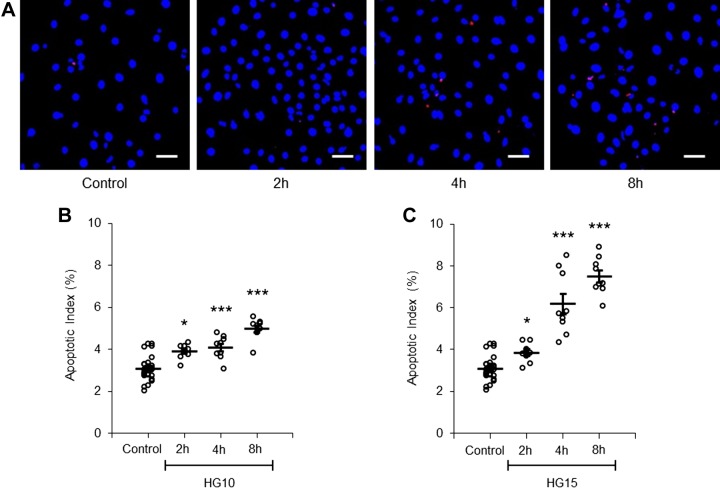
Fig. 2.
Short-time apoptotic response of proximal tubule cells (PTCs) to increased glucose concentration. A: PTCs were stained with TUNEL (red) and DAPI (blue). PTCs were incubated with control (5.6 mM) or 15 mM glucose-containing medium for 2, 4, and 8 h. Scale bars = 40 µm. B and C: quantification of the apoptotic index in PTCs incubated with control or with 10 mM (B; HG10) or 15 mM (C; HG15) glucose-containing medium for 2, 4, and 8 h. Approximately 100–200 cells in 5 separate areas of each coverslip were counted. Data are expressed as means ± SE; n = 9 coverslips from 3 individual cell preparations. *P < 0.05; ***P < 0.001.

