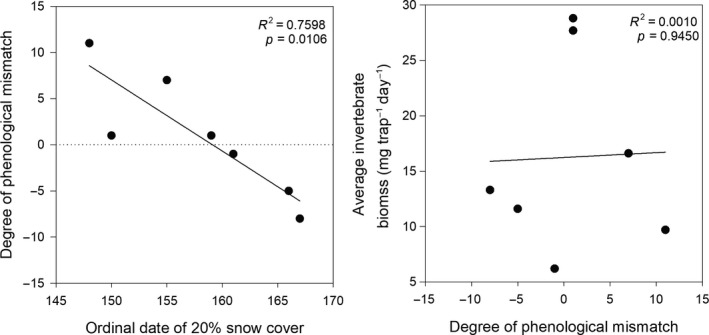
Figure 2.

Degree of phenological mismatch (i.e., number of days between peak insect emergence and peak shorebird hatch) for all species combined relative to timing of snowmelt (left graph) and average invertebrate biomass available to broods (mg trap−1 day−1) that were 2–10 days old (right graph) near Utqiaġvik, Alaska, 2010–2016. The dashed line in the left graph indicates when peak shorebird hatch and insect emergence occurred at the same time; values above the line (positive values) indicate peak shorebird hatch occurred after peak insect emergence, while values below the line (negative values) indicate peak shorebird hatch occurred before peak insect emergence. Each point represents a year. Ordinal date 145 = 25 May (24 May in leap years)
