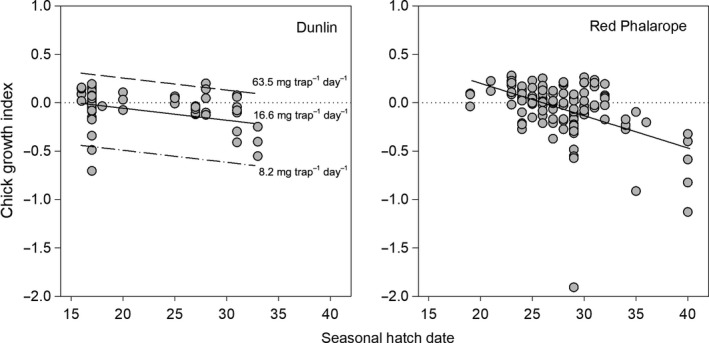
Figure 4.

Dunlin and Red Phalarope chick growth indices (see text for definition) relative to seasonal hatch date (i.e., number of days a nest hatched after the date of 20% snow cover) from top‐ranked linear mixed‐effects models (see Table 3) near Utqiaġvik, Alaska, 2013–2016. For Dunlin, we illustrate the effect of invertebrate biomass (present as an additive effect in the top‐ranked model along with seasonal hatch date) at three levels representing the minimum (dot‐dashes), average (solid), and maximum (dashes) values during the 2–10 day posthatch period. The horizontal dotted line in each graph indicates average growth
