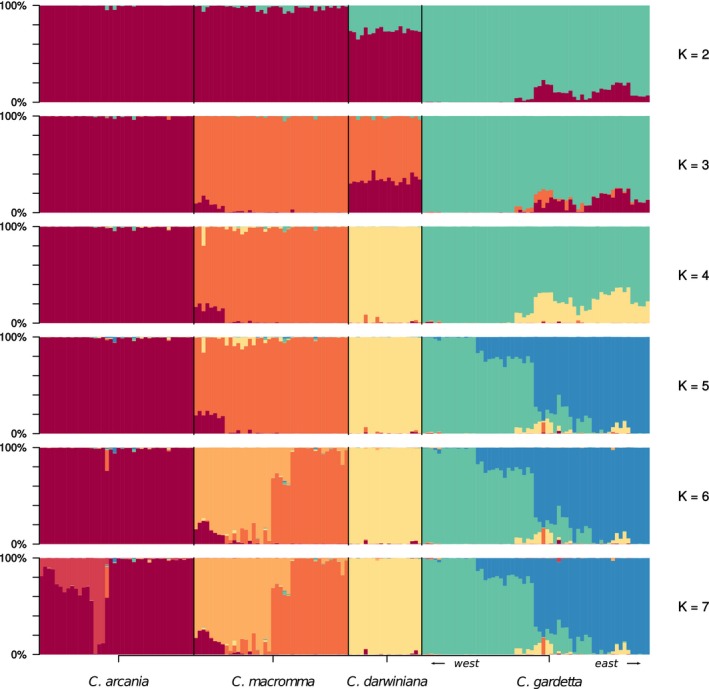
Figure 4.

Genetic structure among and within the four studied species. The barplots indicate the probabilities of assignation of each individual to the K clusters ranging from 2 to 7 (obtained using STRUCTURE software). Only the allopatric populations have been used to produce this figure
