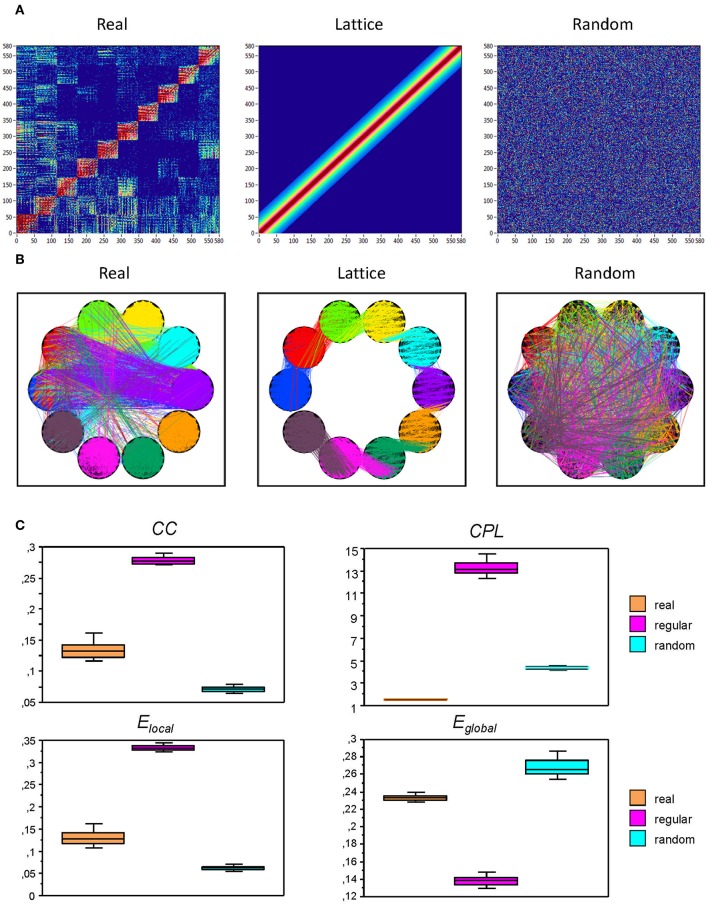
Figure 2.
Representation of real, regular (lattice), and random networks. (A) In the real network (left), the nodes are organized by electrode location and oscillation frequency. The lattice network (middle) was configured by the randomization of the edges in the real network and consecutive redistribution in such a way that the strongest edges lay close to the main diagonal. The random network (right) was configured by the randomization of the edges only. The lattice and random networks were reconstructed in such a way that they have the same number of nodes and edges as the initial real network, but are characterized by ring (lattice) or random network topology. (B) The same networks as in (A), represented in the form of brain maps including WFC (within-frequency coupling) and CFC (cross-frequency coupling). (C) Box plots of the GTA metric for the real and control (regular and random) networks. Box plots of clustering coefficient (CC), characteristic path length (CPL), local efficiency (Elocal), and global efficiency (Eglobal) are presented. For this presentation, data were determined for attended oddball task (AOT) condition and averaged across all subjects.

