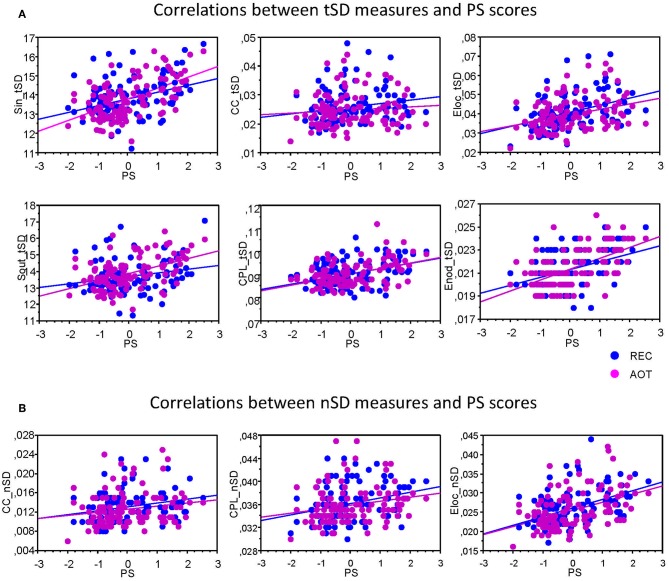
Figure 5.
Correlation plots showing Pearson's product correlations between perceptual speed and network variability measures. (A) Correlations between temporal variability (tSD) and PS composite scores. (B) Correlations between nodal variability (nSD) and PS composite scores. Pearson's product correlations were calculated for each condition separately (see also Table 1 for details) for each of the six GTA measures: In-Strength (Sin), Out-Strength (Sout), Clustering Coefficient (CC), Characteristic Path Length (CPL), Local Efficiency (Elocal), and Global Efficiency (Eglobal). Note that significant correlations are presented.

