
Figure 4.
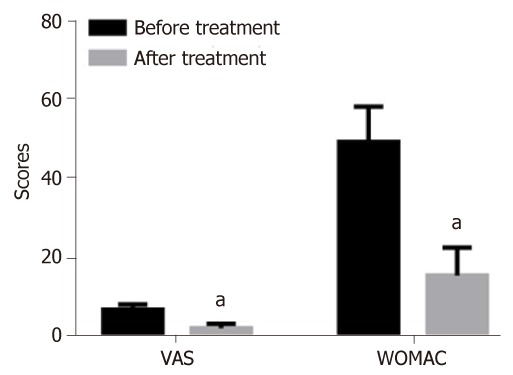
Comparisons of changes in clinical indices before and after treatment. aP < 0.05, vs before treatment. VAS: Visual analogue scale; WOMAC: Western Ontario and McMaster University of Orthopaedic Index.
Official websites use .gov
A
.gov website belongs to an official
government organization in the United States.
Secure .gov websites use HTTPS
A lock (
) or https:// means you've safely
connected to the .gov website. Share sensitive
information only on official, secure websites.
Comparisons of changes in clinical indices before and after treatment. aP < 0.05, vs before treatment. VAS: Visual analogue scale; WOMAC: Western Ontario and McMaster University of Orthopaedic Index.