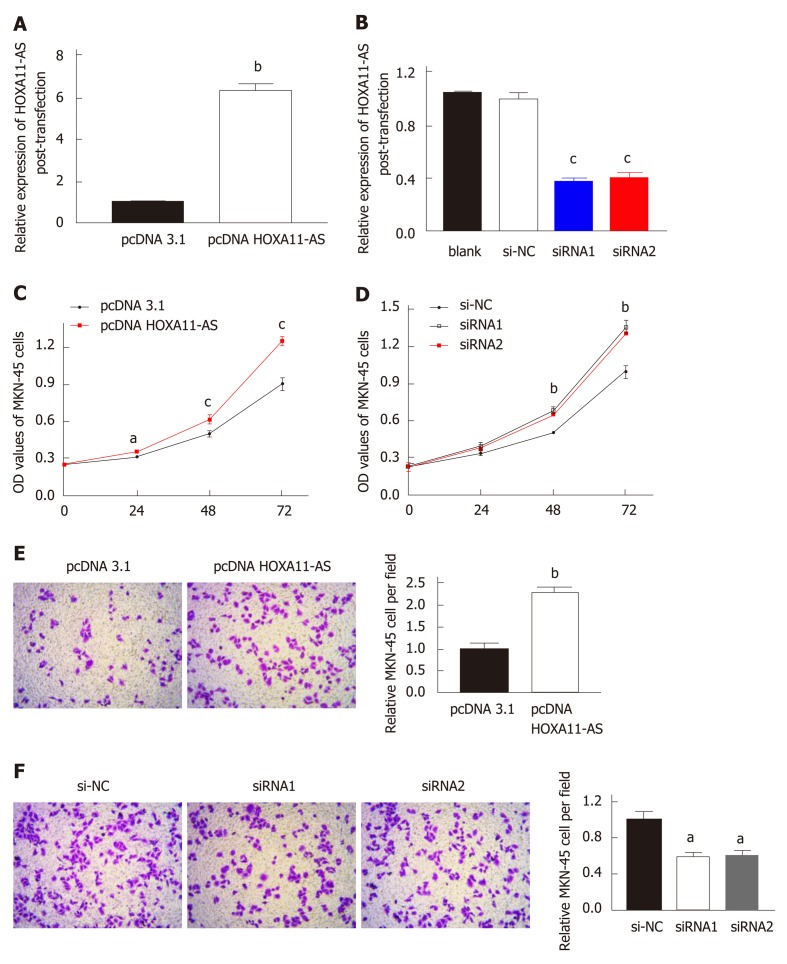
Figure 4.
Transfection efficiencies and cell function assays. A and B: Transfection efficiencies of pcDNA-HOXA11-AS (A) and HOXA11-AS-siRNA (B) in gastric cancer cells; C and D: Migration of MNK-45 cells after HOXA11-AS overexpression (C) or knockdown (D); E and F: Invasion of MNK-45 cells after HOXA11-AS overexpression (E) or knockdown (F). The assays were repeated three times. aP < 0.05, bP < 0.01, cP < 0.001. OD: Optical density; NC: Normal control.

