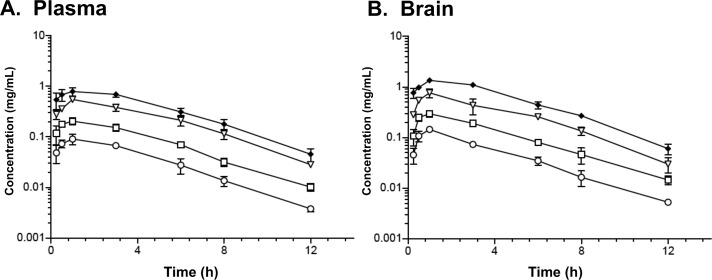
Figure 7.
Exposure of compound 11 in plasma and brain after oral administration. Oral gavage administration results in comparable profiles for plasma (A) and brain (B). Oral doses (mg/kg): 1.25 (circles), 2.5 (squares), 5 (triangles), 10 (diamonds). Sampling time points (h): 0.25, 0.5, 1, 3, 6, 8, 12. Drug concentrations in biological matrices were determined by LC–MS/MS as described in Experimental Section.

