Fig. 5.
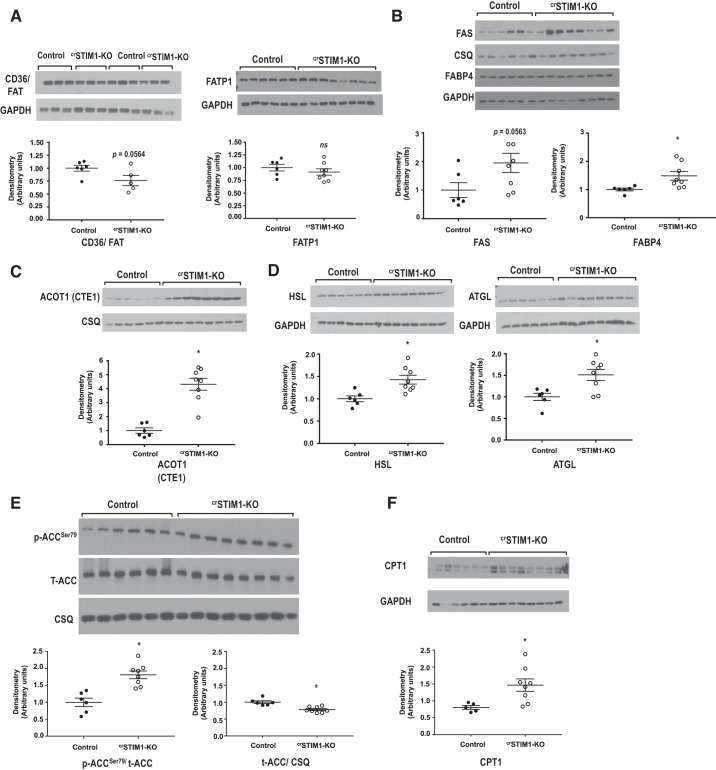
Effect of cardiomyocyte-restricted deletion of stromal interaction molecule 1 (crSTIM1-KO) on proteins that regulate lipid metabolism. A, top: immunoblots illustrating fatty acid translocase (CD36/FAT) and fatty acid transporter 1 (FATP1) whole cell expression levels in freshly isolated control and crSTIM1-KO hearts. A, bottom: densitometric analysis of the immunoblots shown at the top. B, top: Immunoblots illustrating fatty acid synthase (FAS) and fatty acid-binding protein 4 (FABP4) whole cell expression levels in freshly isolated control and crSTIM1-KO hearts. B, bottom: densitometric analysis of the immunoblots shown at the top. C, top: immunoblots illustrating acyl-CoA thioesterase 1 (ACOT1) whole cell expression levels in freshly isolated control and crSTIM1-KO hearts. C, bottom: densitometric analysis of the immunoblots shown at the top. D, top: immunoblots illustrating hormone-sensitive lipase (HSL) and adipose triglyceride lipase (ATGL) whole cell expression levels in freshly isolated control and crSTIM1-KO hearts. D, bottom: densitometric analysis of the immunoblots shown at the top. E, top: immunoblots illustrating phosphorylated (p-)acetyl-CoA-carboxylase (ACC)/total (t-)ACC and t-ACC/calsequestrin (CSQ) in freshly isolated hearts from control and crSTIM1-KO mice. E, bottom: densitometric analysis of the immunoblots shown at the top. F, top: immunoblots illustrating whole cell carnitine palmitoyltransferase I (CPT1) expression in freshly isolated hearts from control and crSTIM1-KO mice. F, bottom: densitometric analysis of the immunoblots shown at the top. Protein expression was normalized to GAPDH or CSQ expression, where necessary. For FATP1, FAS, FABP4, and ACOT1 blots, n = 6 control mice and n = 7/8 crSTIM1-KO mice; for CD36/FAT, ACC, and CPT1 blots, n = 5/6 control mice and n = 5/6 crSTIM1-KO mice. *P < 0.05 vs. age-matched control mice (Student’s t-test).

