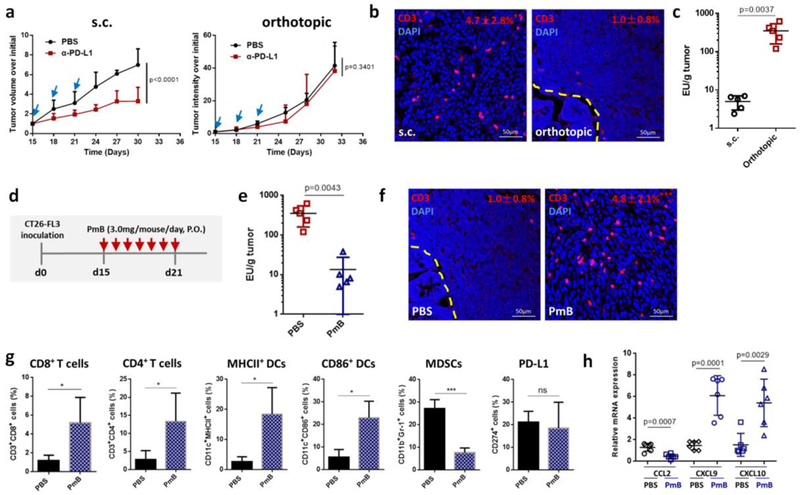
Figure 1.

a) Growth curves of s.c. and orthotopic CT26-FL3 tumors treated with PBS or 100 μg/mouse anti-PD-L1 antibody (n = 5 mice per group). b) CD3-immunofluorescence images of s.c. and orthotopic CT26-FL3 tumors. Yellow dashed line indicates the boundary between intestinal mucosa and the orthotopic tumor. * p < 0.05, comparison of CD3+ ratios between s.c. tumor and orthotopic tumor (n = 12 to 15 region of interest (ROI) from four tumors per group). c) Endotoxin test of s.c. CT26-FL3 tumors and orthotopic CT26-FL3 tumors (n = 5). d) Treatment schedule of PmB on orthotopic CT26-FL3 tumor bearing mice. e) Endotoxin test of orthotopic CT26-FL3 tumors in mice treated with PBS and PmB (n = 5). f) CD3-immunofluorescence images of orthotopic CT26-FL3 tumor in mice treated with PBS or PmB (day 22 after tumor inoculation). *** p < 0.001, comparison of CD3+ ratios between PBS and PmB groups (n = 12 to 15 ROIs from four tumors per group). g) Flow cytometry analysis of orthotopic CT26-FL3 tumors in PBS and PmB treated groups (day 22, n = 4). ns, no significant difference, * p<0.05, ***p<0.001. h) Relative mRNA expression of various cytokines and chemokines in the PBS and PmB treated tumors (on day 22, n = 6). Significant differences were assessed in a using two-way ANOVA with multiple comparisons and in others using t test. Results are presented as mean (SD).
