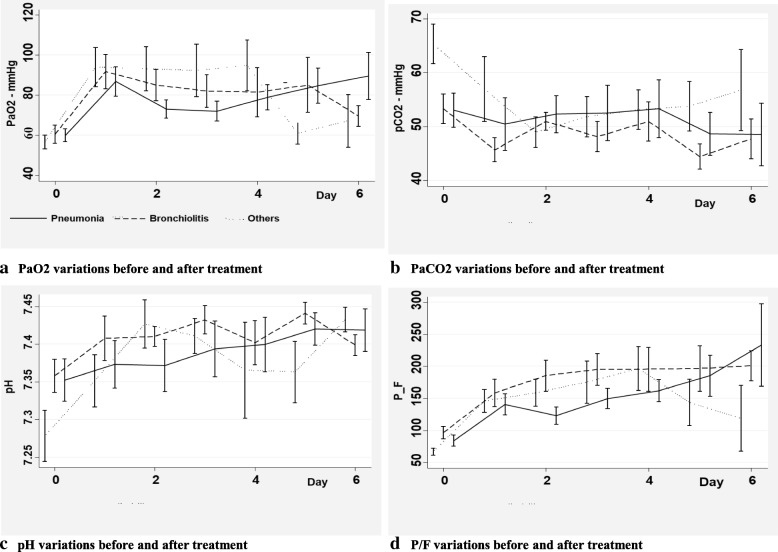
Fig. 3.
Blood gases variations in different subgroups of diagnosis immediately before and after surfactant administration. a: PaO2 variations before and after treatment. b: PaCO2 variations before and after treatment. c: pH variations before and after treatment. d: P/F variations before and after treatment. Legend: Data are expressed as means and standard errors. PaO2 = oxygen arterial pressure; PaCO2 = carbon oxide arterial pressure; P/F = oxygen arterial pressure inspired oxygen fraction ratio

