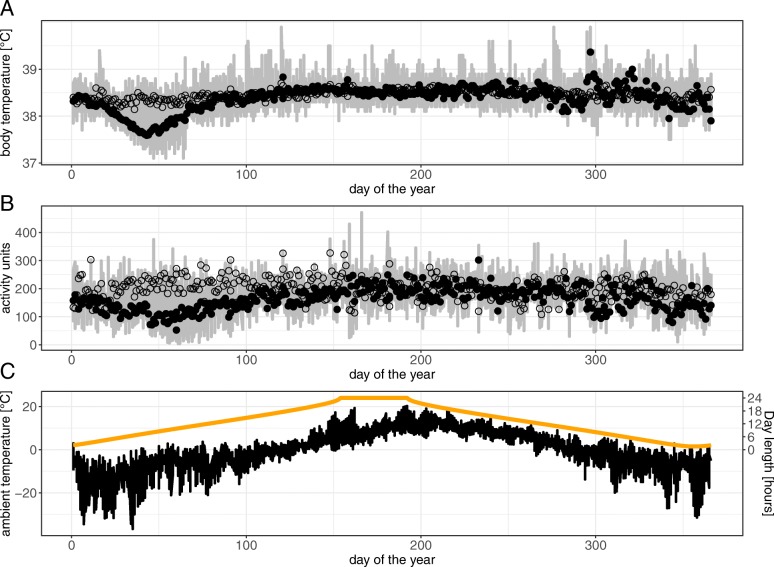
Fig. 2.
Daily averaged (a) body temperature (Tb, [°C]) and (b) activity of each individual wolverine (grey line) and all individuals together (pregnant individuals: black dots, non-pregnant individuals: hollow circles) and (c) daily averaged ambient temperature from 2011 to 2014 [°C] (black lines) and day length [hours] (orange line)

