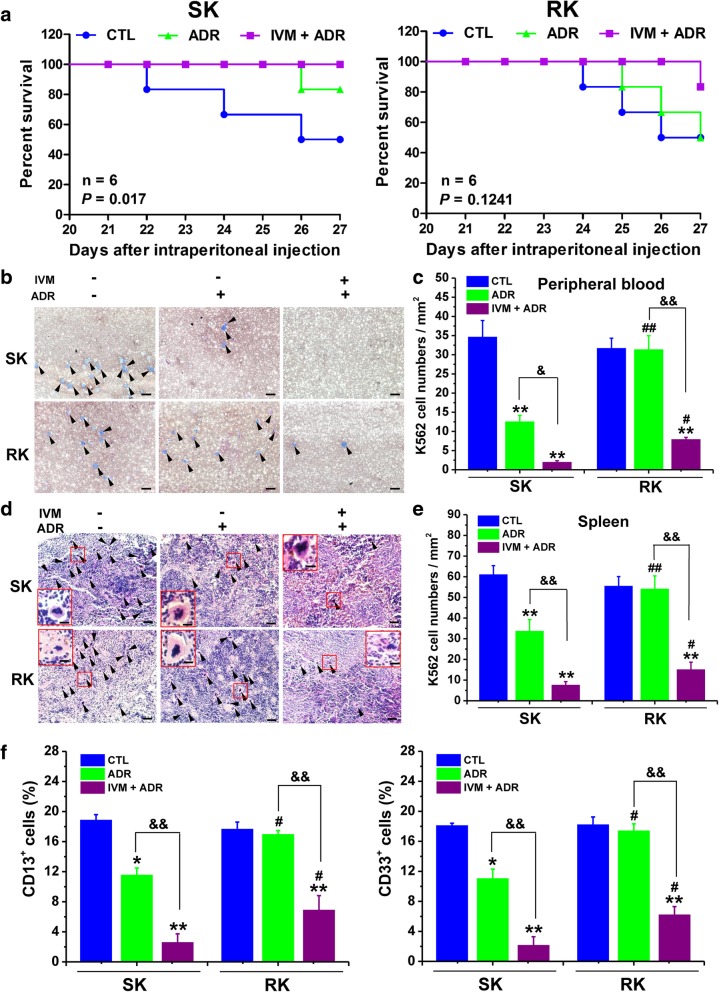
Fig. 3.
Ivermectin enhances the anti-cancer effect of adriamycin in a mice model for human leukemia. The NOD/SCID mice were injected through tail vein with 2×10⁷ K562 cells, which are sensitive or resistant to adriamycin (ADR). Then, the mice were treated with ADR (0.3 mg/kg, i.p.) alone or combined with ivermectin (IVM) (2 mg/kg, i.p.) daily for 27 days. a Survival percentage of the mice were calculated. b and c The May-Grünwald Giemsa (MGG) staining (b) and the K562 cell numbers (c) of the peripheral blood smear from the mice were determined. Scale bars: 150 μm. d The histopathological examination of spleen with hematoxylin and eosin (H & E) staining. Scale bars: 150 μm. The arrowheads indicate the K562 cells. The images within the red rectangles were enlarged as insets (scale bars: 30 μm). e The K562 cell numbers in spleen were determined based on the spleen H & E staining results. f The percentage of cells stained positive for cell surface markers CD13 or CD33 in bone marrow were determined by flow cytometry. Abbreviations: CTL, control; SK, adriamycin-sensitive K562 xenograft; RK, adriamycin-resistant K562 xenograft. Data represent the mean ± SD (n = 6). Statistical significances in a were determined by using the log-rank test. Statistical significances in c, e, and f were determined by using one-way ANOVA followed by Dunnett’s test. *P < 0.05, **P < 0.01, compared with the respective vehicle controls (blue columns); #P < 0.05, ##P < 0.01, compared with the corresponding columns with the same color in the SK group; &P < 0.05, &&P < 0.01, comparison between the two columns (purple column vs green column)

