Figure 5.
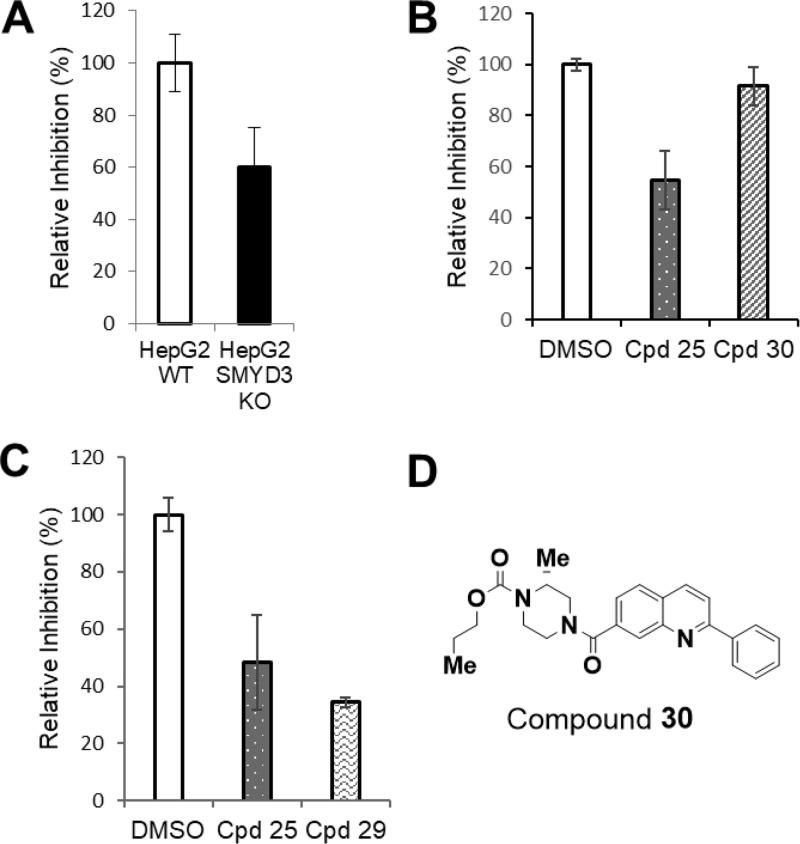
(A) Relative levels of MAP3K2-me2/me3 in wild type HepG2 vs SMYD3 KO HepG2 clone 4. (B) Relative levels of MAP3K2-me2/me3 in HepG2 when treated with DMSO and compounds 25 and 30 at 20 μM for 24 h. (C) Relative levels of MAP3K2-me2/me3 in HepG2 when treated with DMSO and compounds 25 and 29 at 20 μM for 24 h. (D) Chemical structure of 30.

