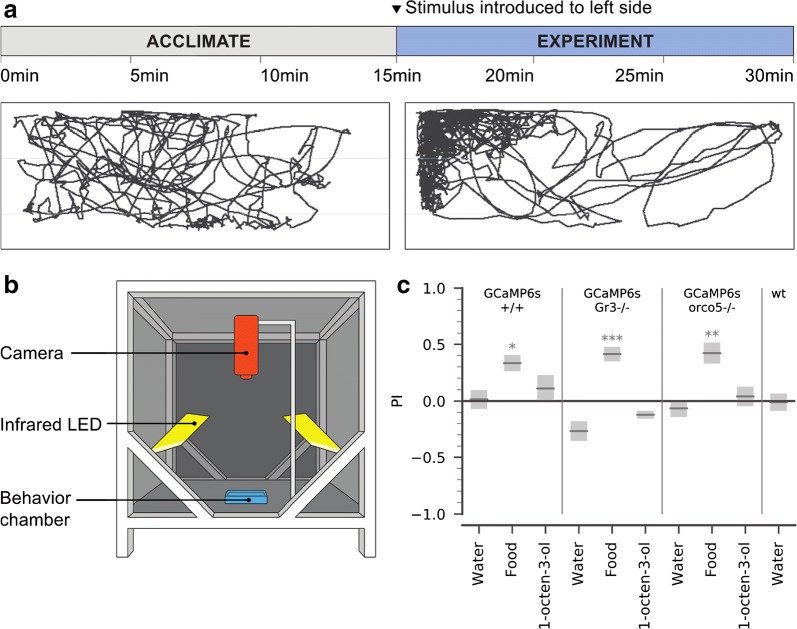
Fig. 4.
Behavioral analysis of stimulus-evoked responses in GCaMP6s/+/+, GCaMP6s/orco5−/−, GCaMP6s/Gr3−/−, and wt larvae. a In each experiment, the larva was allowed to acclimate in the arena for 15 min. Next, 100 µL of one stimulus was introduced to the upper left side of the arena. In both stages, larval behavior was recorded at 2fps, and larval position in each frame was extracted using ImageJ and Python. This example trajectory shows the movement of a GCaMP6s/orco5−/− larva before and after the addition of 100 µL food extract. b The dark experimental arena used for behavior testing. Animals were released individually into a custom 3D printed porcelain behavior chamber (blue), lit with infrared LED panels (yellow) and recorded with a Basler Scout Machine Vision Area Scan GigE camera (orange). c Using these trajectories, we compared PI (defined as the proportion of time spent in the odor half of the arena minus the proportion of time spent in the non-odor half) across all larvae during the acclimation and experiment phase. Gray bars show mean ± SEM during the experiment phase. p-values: pairwise T-test comparing acclimation period to experiment period. *: p-value < 0.05, **: p-value < 0.01, ***: p-value < 0.001. GCaMP6s/+/+: water n = 20; 1-octen-3-ol n = 14; food extract n = 20. GCaMP6s/orco5−/−: water n = 24; 1-octen-3-ol n = 16; food extract n = 20. GCaMP6s/Gr3−/−: water n = 16; 1-octen-3-ol n = 17; food extract n = 16; Liverpool wt: water n = 19

