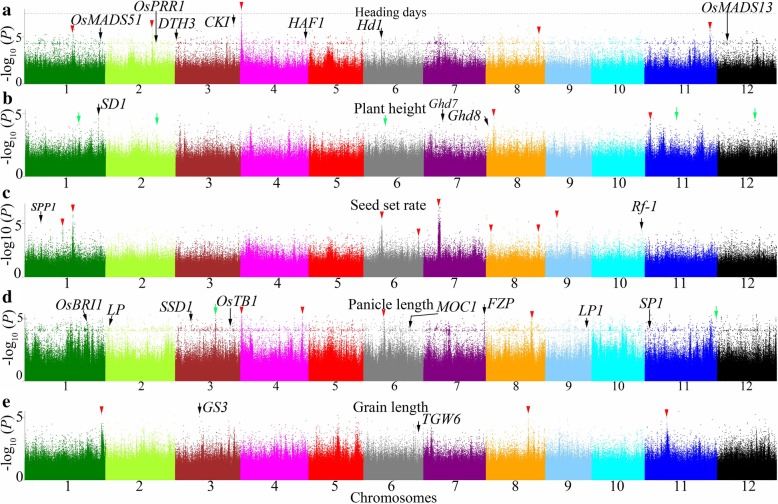
Fig. 4.
Manhattan plots of EMMAX for 5 agronomic traits in genome-wide association studies. Negative log10(P) values from a genome-wide scan are plotted against position on each of 12 chromosomes. a Manhattan plots of EMMAX for heading days. Red horizontal dashed line indicates the genome-wide significant threshold; b Manhattan plots of EMMAX for plant height; c Manhattan plots of EMMAX for seed set rate; d Manhattan plots of EMMAX for panicle length; e Manhattan plots of EMMAX for grain length. Black, red and green arrow represent the loci close to previous genes, new loci and identical in Guangzhou and Hangzhou, respectively

