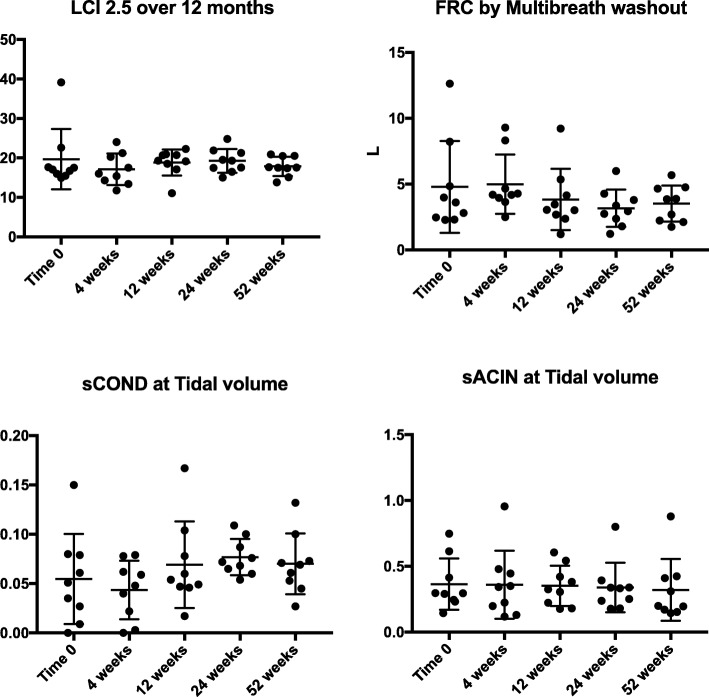
Fig. 3.
Data on the Nitrogen MBW. The data relates to the 10 subjects treated with LUM/IVA over 12 months. Individual data points are represented as well as the median and interquartile range. Analysis was done using one-way ANOVA with Dunnett’s multiple comparisons test. The overall ANOVA p value is given. No values are given for the y axis as these changes are without dimension

