
Fig. 3.
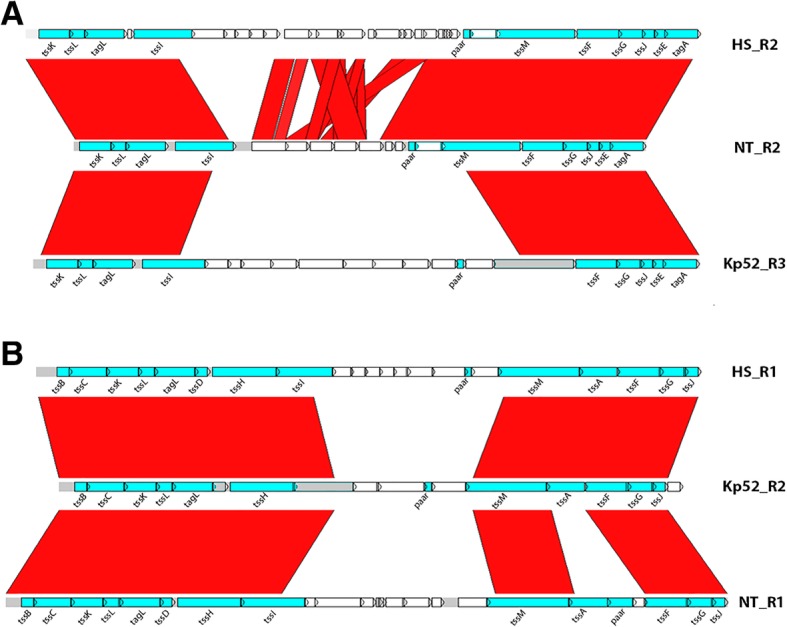
Comparative analysis of genomic regions encoding T6SS-related genes in K. pneumoniae strains Kp52.145 (Kp52), NTUH-K2044 (NT) and HS11286 (HS). Genomic regions in each genome were named R1, R2 and R3, according to their genomic locations. BLASTN analysis was performed using DoubleACT 2.0 and displayed with the ACT software. T6SS-related genes are represented in blue arrows, non-T6SS genes in white. Pseudogenes are displayed in gray. Regions of synteny between the sequences are displayed in red blocks