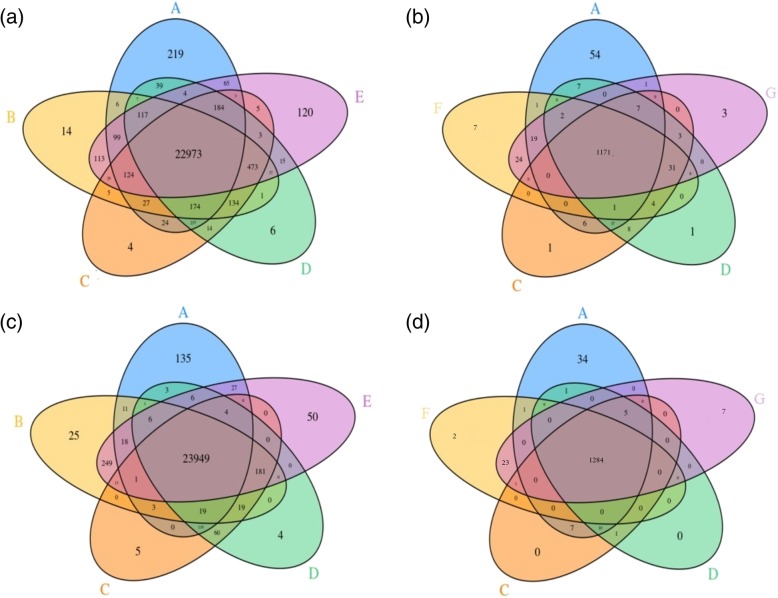
Fig. 6.
Venn diagram depicting the comparison of top four pipelines. GiaB variants (a) compared against the top 4 performing pipelines (b) BWA_SAMtools, (c) BWA_DeepVariant, (d) Novoalign_DeepVariant, (e) Novoalign_SAMtools, (f) BWA_GATK and (g) Novoalign_GATK for SNVs (a, c) and InDels (b, d) on exome-1 (top row) and exome-2 (bottom row)

