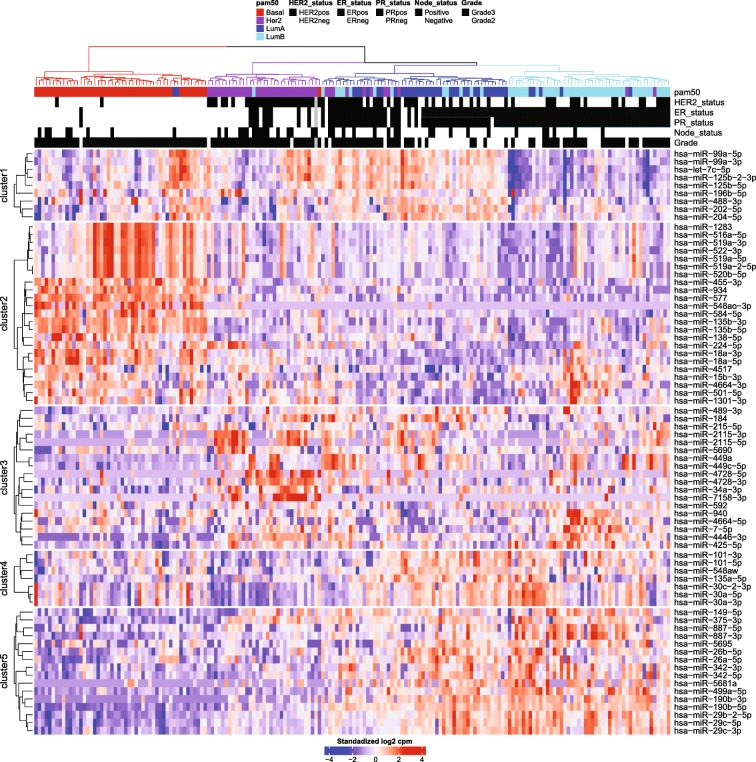
Fig. 2.
Sample clustering and heatmap for the expression of a set of 73 unique miRNAs collected from the 15 most significantly differentially expressed miRNAs from each comparison between tumor subtypes. Samples are colored by subtype according to the PAM50 classification. Red = Basal-like, purple = HER2-enriched, blue = Luminal A, and cyan = Luminal B. The miRNA expression values were standardized by row mean centering and dividing by row standard deviation in R before distance calculation and clustering

