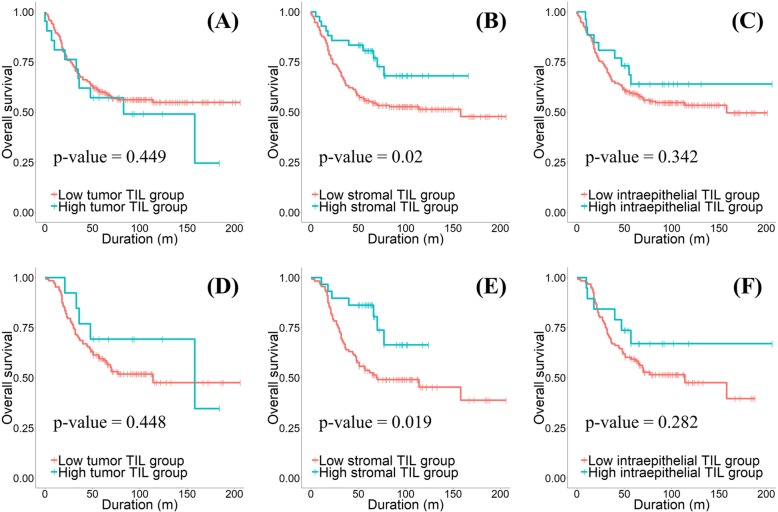
Fig. 2.
The results of Kaplan-Meier curve analysis and Log rank test for overall survival according to the tumor PD-L1 expression groups (a, p-value = 0.449), the stromal PD-L1 expression groups (b p-value = 0.020), and the intraepithelial PD-L1 expression groups (c p-value = 0.342) in all histologic types of epithelial ovarian cancers. The results of Kaplan-Meier curve analysis and Log rank test for overall survival according to the tumor PD-L1 expression groups (d p-value = 0.448), the stromal PD-L1 expression groups (e p-value = 0.019), and the intraepithelial PD-L1 expression groups (f p-value = 0.282) in ovarian serous carcinomas

