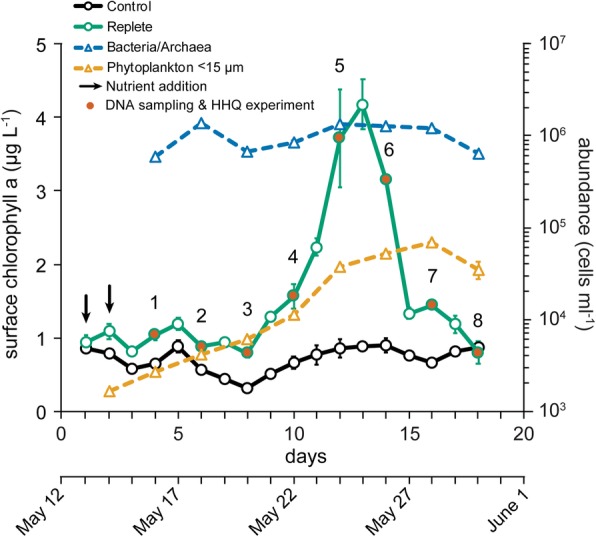
Fig. 1.

Mesocosm chlorophyll a and microbial cell concentrations. Chlorophyll a samples were taken from nutrient replete (green circles and black arrows) and unamended control mesocosms (black circles). Samples for total bacteria/archaea (blue triangles) and total phytoplankton < 15 μm (orange triangles) cell abundances were taken from replete mesocosms. DNA sampling and 2-heptyl-4-quinolone manipulations occurred at eight experimental time points (labeled 1 through 8) during sampling (red circles). All samples were taken from a depth of 1 m and symbols represent the mean (± s.d.) of biological triplicates.
