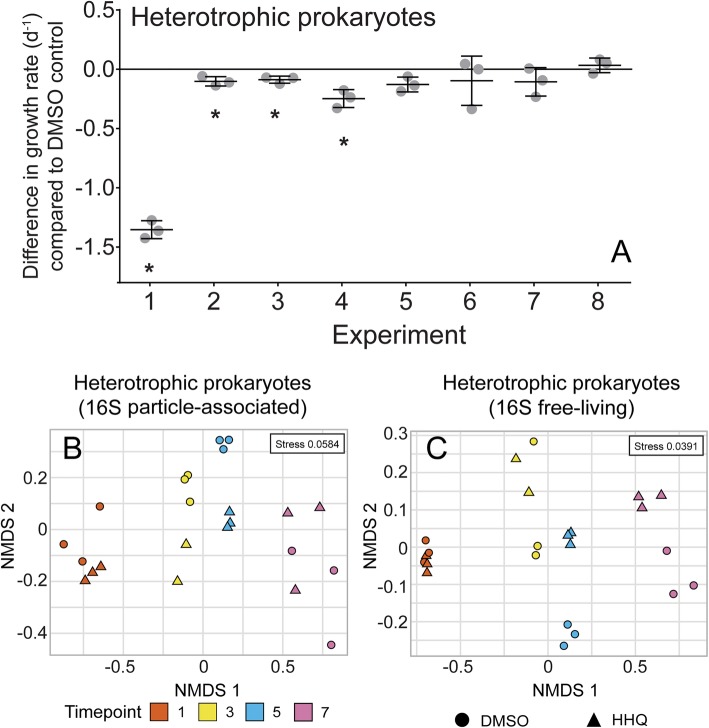
Fig. 5.
Response of microbial communities to HHQ exposure. Difference in growth rate (d−1) in heterotrophic prokaryote abundance after 24 h exposure to 410 μM (100 ng mL−1) 2-heptyl-4-quinolone (HHQ) compared to the DMSO control determined by flow cytometry over eight experimental time points (a). Bars represent the mean (± s. d.) of biological triplicate and asterisks indicate significant changes in the growth rate of the bulk communities between the two treatments (p < 0.05). Ordination of heterotrophic prokaryote communities based on particle-associated 16S rRNA (b) and free-living 16S rRNA (c) amplicon sequence variants visualized by non-metric multidimensional scaling (NMDS) of Bray-Curtis distance. Circles and triangles correspond to DMSO control and HHQ exposed communities, respectively. Symbol color denotes experimental time point.

