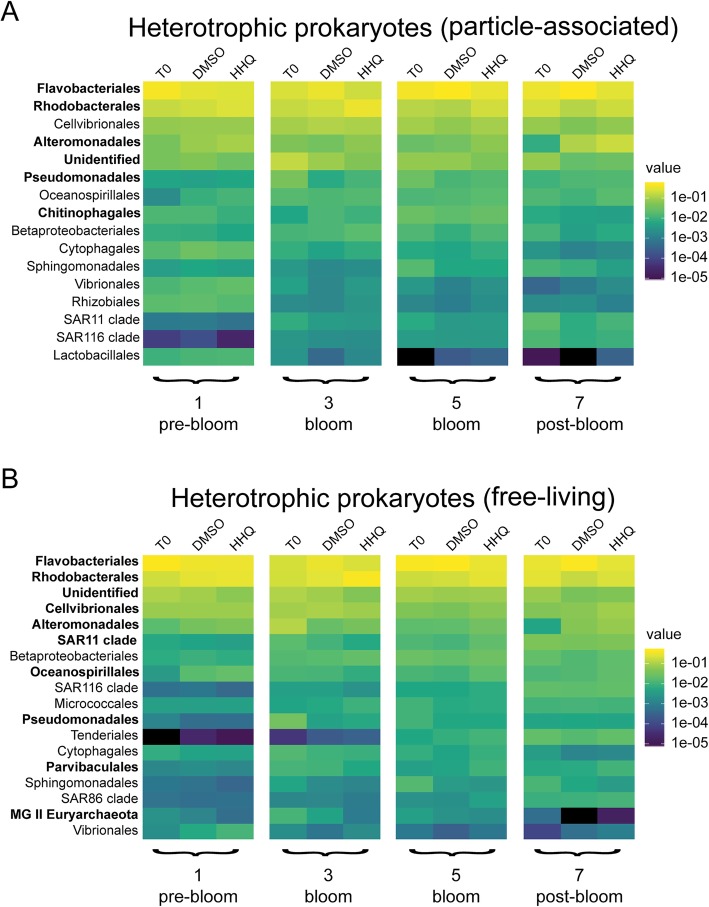
Fig. 6.
Heatmap showing average relative abundances of microbial communities after HHQ exposure. Relative abundance of heterotrophic prokaryotes in particle-associated (> 1 μm) (a) and free-living (b) communities for orders representing ≥ 1% of the community in at least one sample. Experimental time points and bloom phase is noted below each heatmap. Each column represents the mean of triplicate samples taken from replete mesocosms (T0) or exposed for 24 h to DMSO or 2-hepyl-4-quinolone (HHQ). Bolded taxa contain amplicon sequence variants that changed (+/−) significantly (BH-adjusted p value < 0.1) in relative abundance after HHQ exposure compared to the DMSO control.

