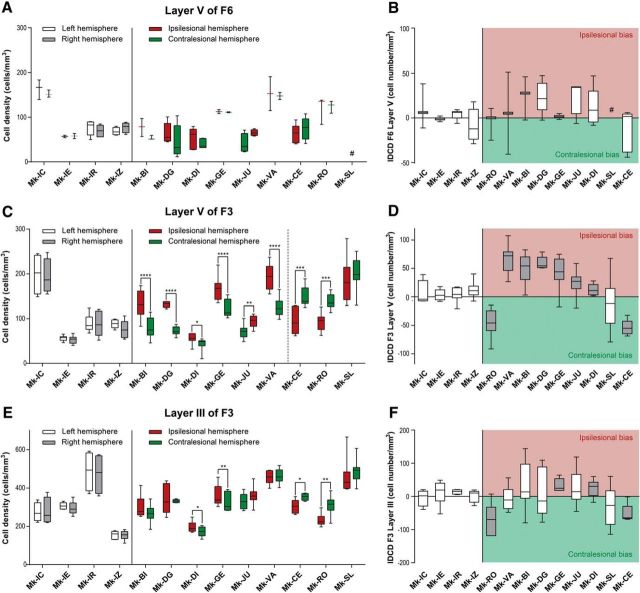
Figure 3.
Box plots of interhemispheric morphological data obtained in the three investigated cortical regions (layer V of F6; layer V of F3; layer III of F3): cell density on both hemispheres in A, C, and E, and IDCD in corresponding regions in B, D, and F. A, C, E, Box plots showing the SMI-32-positive cell densities in layer V of F6 (A), as well as in layer V (C) and layer III (E) of F3 in each hemisphere for each monkey. In the four intact monkeys, the cell density in the left and right hemispheres is represented in white and gray, respectively. In the nine monkeys subjected to unilateral M1 lesion, the cell density in the ipsilesional and contralesional hemispheres is represented in red and green, respectively. As statistical test, a paired t test or Wilcoxon test was performed (*p ≤ 0.05, **p ≤ 0.01, ***p ≤ 0.001, ****p ≤ 0.0001), comparing the density in the two hemispheres in each consecutive histological section. The absence of asterisks means “not statistically significant” (p > 0.05). B, D, and F, Box plots showing the IDCD of SMI-32-positive cells in layer V of F6 (B), as well as in layer V (D) and layer III (F) of F3 in each monkey. Lesioned animals, on the right, were ordered from left to right according to an increasing M1 lesion volume. The white boxes point to the animals with a non-statistically significant IDCD, whereas the gray boxes show the animals with a significant IDCD. B, All boxes should appear in white as none of the IDCDs are statistically significant (a few boxes are too small to appear white at that scale). A positive IDCD corresponds to an ipsilesional bias in pyramidal SMI-32-positive neurons density, whereas a negative IDCD corresponds to a contralesional bias. In all plots, the ID of each individual monkey is indicated along the abscissa. #, missing data.

