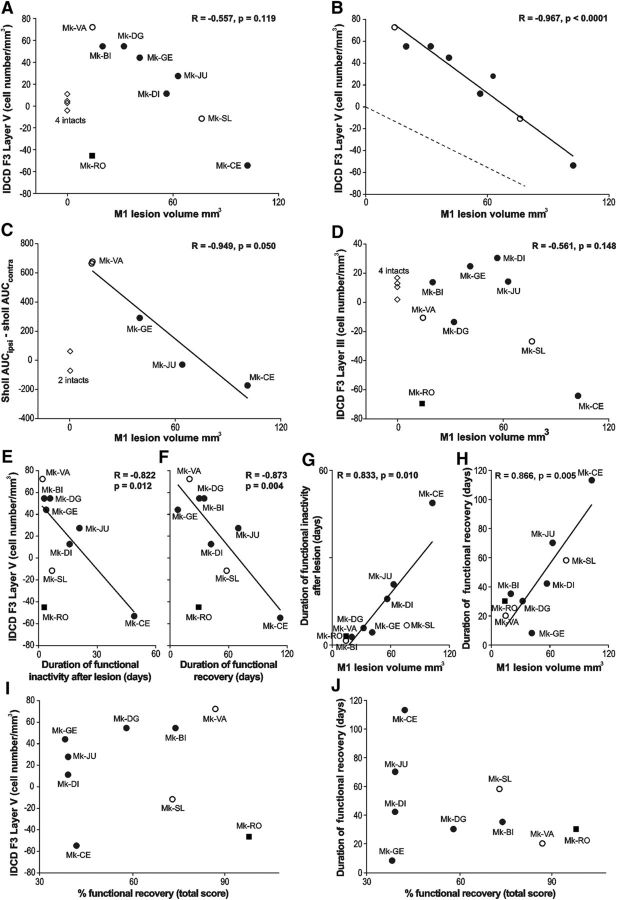
Figure 5.
A, B, D, The IDCD in F3 (A, B, layer V; D, layer III) was plotted as a function of the M1 lesion volume. A, Includes all animals, whereas the intact monkeys, as well as the outlier Mk-RO (square), have been omitted in B (see Results). B, The dashed line represents the hypothesized interhemispheric cell density asymmetry (see Introduction). D, The regression line and the correlation coefficient do not include the intact monkeys and the outlier Mk-RO. C, The correlation between the dendritic Sholl analysis (AUC) and the M1 lesion volume (without the 2 intact monkeys). E–H, Focus on possible behavioral correlates, such as duration in days of functional inactivity after lesion (E, G) and duration of functional recovery (F, H). These two behavioral parameters were correlated with the IDCD in F3 layer V in E and F, as well as with the M1 lesion volume in G and H. I, J, The absence of statistically significant correlation between: the IDCD in F3 layer V and the extent (percentage) of functional recovery (I; r = 0.049; p = 0.900); The duration of functional recovery and the extent of functional recovery (J; r = 0.355; p = 0.349).

