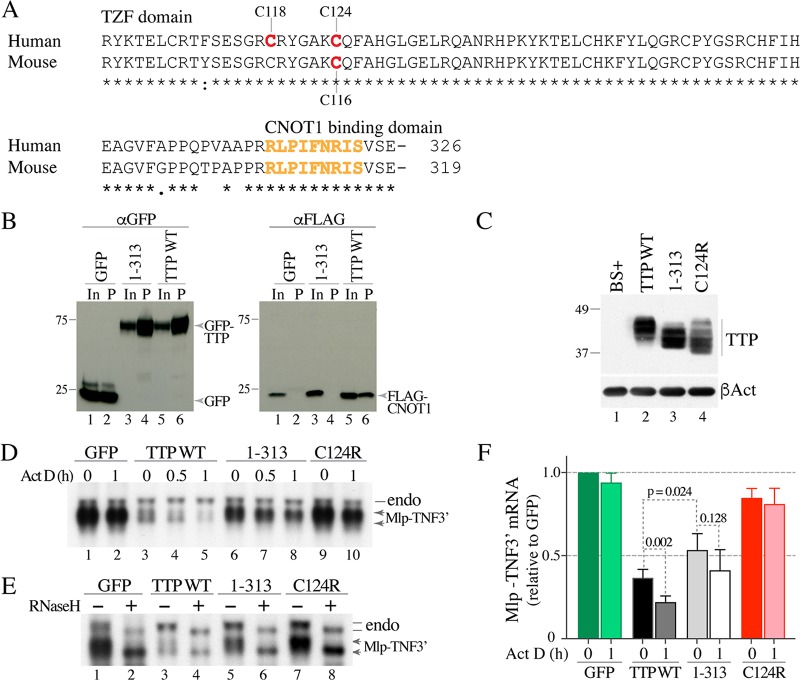
FIG 1.
Involvement of the TTP CNBD in Mlp-TNF3′ fusion mRNA decay. (A) Sequences of the TZF domains and the C-terminal CNBD from human and mouse TTP, aligned with ClustalW. The locations of the cysteines changed to arginines in the various mutants discussed in this paper are shown. The residues reported to bind to CNOT1 in human TTP (7) are highlighted in orange. Asterisks under the alignments indicate amino acid identity at those sites, a colon indicates amino acid conservation, and a single dot represents less conservation at that site. The numbers at the end of the alignment indicate the numbers of amino acids in the full-length proteins. (B) Results of a coimmunoprecipitation experiment in HEK 293 cells that had been cotransfected with a FLAG-CNOT1800–1020 plasmid and one of three constructs expressing GFP or TTP-GFP fusion proteins: GFP alone (lanes 1 and 2), a C-terminally truncated version of TTP lacking the CNBD (1–313) (lanes 3 and 4), and WT human TTP (lanes 5 and 6). The Western blot shown on the left was blotted with an anti-GFP antibody, and the blot on the right was blotted with an anti-FLAG antibody. In both blots, lanes 1, 3, and 5 show the input extracts (In) that were not incubated with the anti-GFP resin, and lanes 2, 4, and 6 show the proteins that were eluted from the anti-GFP resin (P) after incubation with the indicated extracts. The migration positions of molecular weight standards are shown on the left of the blots, and the migration positions of the fusion proteins (blot on left) or the CNOT1 protein fragment (blot on right) are shown to the right of the blots. (C) Top, Western blot of the various hTTP.tag proteins expressed in HEK 293 cells transfected with WT or mutant constructs, as indicated. The migration positions of molecular weight standards are shown on the left. BS+ indicates cells transfected with the backbone vector alone. Bottom, results of blotting with an anti-β-actin antibody (βAct). (D) Representative Northern blot of the Mlp-TNF3′ fusion mRNA from HEK 293 cells that had been cotransfected with the Mlp-TNF3′ plasmid and one of four constructs expressing GFP or GFP-TTP fusion proteins: a negative control, GFP (lanes 1 and 2); WT human TTP (lanes 3 to 5); TTP 1–313 mutant construct (lanes 6 to 8); and the known inactive TTP mutant construct C124R (lanes 9 and 10). The transfected cells were treated without (ActD 0) or with ActD for the times indicated (0.5 or 1 h). On the right, the migration position of the endogenous Mlp mRNA (endo) is indicated by a line, and that of the fusion Mlp-TNF3′ mRNA is indicated by double arrows. The lower arrow indicates the deadenylated form of the Mlp-TNF3′ transcript. (E) Results of an RNaseH assay using total cellular RNA from cells not treated with ActD. On the right, the migration positions of the endogenous Mlp mRNA (endo) are indicated by two lines, and those of the fusion Mlp-TNF3′ mRNAs are indicated by two arrows. For each mRNA, the upper line or arrow indicates the fully polyadenylated mRNA species, whereas the lower line or arrow indicates the deadenylated form of the mRNA. (F) Relative levels of Mlp-TNF3′ mRNA (mean values ± SD) from four independent experiments. Both bands shown in panel D were used in the phosphorimager quantitation of the Northern blots. Darker bars (ActD 0) represent relative Mlp-TNF3′ transcript values at steady state, before the addition of ActD, and lighter bars (ActD 1 h) represent relative transcript levels after ActD treatment. See the text for calculations and other details.

