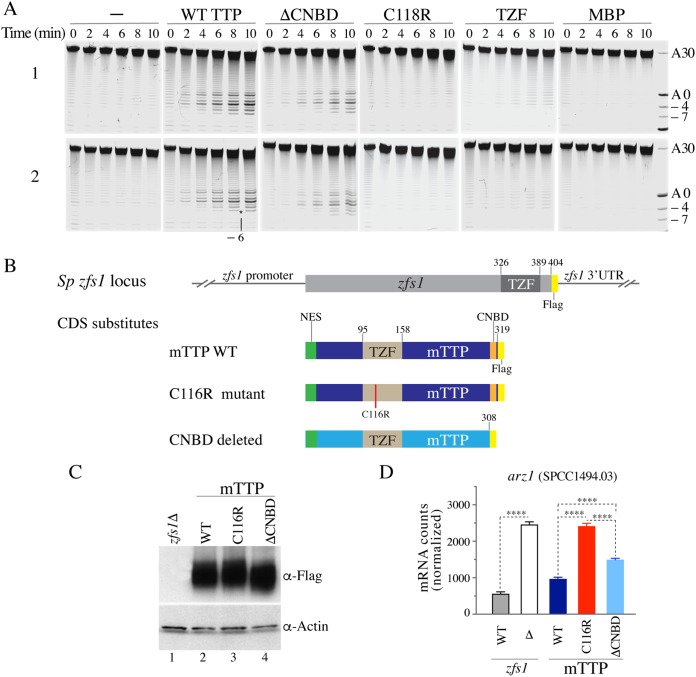
FIG 2.
TTP-stimulated deadenylation of recombinant S. pombe CCR4-NOT complexes in vitro, and TTP-stimulated mRNA decay in S. pombe in vivo. (A) Two independent replicate deadenylation assays (1 and 2). The ARE-containing RNA probe and the purified recombinant CCR4-NOT complexes were incubated for the times indicated with no additions (−) or in the presence of identical concentrations of various purified recombinant human TTP proteins, including the WT TTP-MBP fusion protein, the ΔCNBD-MBP fusion protein, representing the human version of the mouse TTPΔCNBD mutant, the C118R-MBP fusion protein, representing the non-RNA binding TZF domain mutant of human TTP, TZF (the human TTP TZF domain alone), and MBP (MBP protein alone). Numbers on the right indicate the poly(A) tail lengths, and negative numbers indicate the numbers of nucleotides removed immediately 5′ of the poly(A) tail. The asterisk indicates the removal of 6 nucleotides (−6) between the TTP binding site sequence and the poly(A) tail. (B) Schematic representation of the S. pombe zfs1 locus, in which the protein coding domain of zfs1 was replaced by either an epitope-tagged version of Zfs1 or the indicated full-length mouse TTP or its mutant protein coding sequences (CDS), in all cases epitope tagged. Note that in all cases, the endogenous zfs1 promoter region and 3′ UTR remained intact. (C) Western blot in which each lane contained identical concentrations of protein extracts from cells expressing the mouse proteins described in panel B, with the first lane containing an extract from the zfs1Δ cells. (D) Results of a NanoString assay of Arz1 (SPCC1494.03) mRNA levels, with the first bar labeled WT representing RNA from S. pombe cells expressing full-length, FLAG-tagged Zfs1, as shown schematically in panel B, and the second bar labeled WT representing RNA from cells expressing WT mouse TTP in place of Zfs1. Each bar represents the mean value ± SD of data from 4 independent isolates. The results were analyzed by one-way ANOVA with Tukey’s multiple comparison test. The asterisks indicate adjusted P values of <0.0001 in all comparisons.

