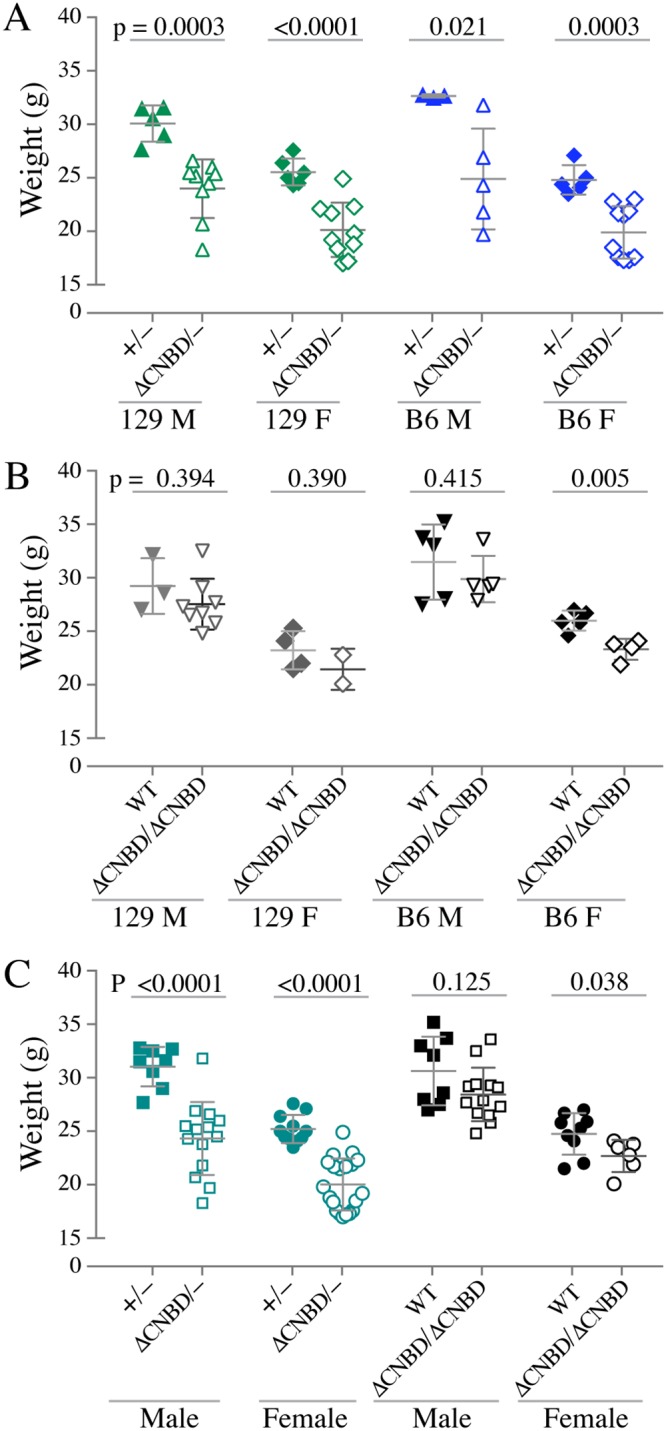
FIG 4.

Body weights at 24 weeks of age. Body weight measurements for mice of all genotypes and both sexes at 24 weeks of age are shown as scatter plots, in which each dot represents the weight of an individual mouse. Also shown are the mean values ± SD, as well as the P value for each comparison, calculated from two-tailed, unpaired t tests with Welch’s correction. (A) Comparisons between TTP+/− and TTPΔCNBD/− mice of the indicated sex and background. (B) Comparisons between WT and TTPΔCNBD/ΔCNBD mice of the indicated sex and background. (C) Comparisons between mice of the same pairs of genotypes when weights from mice of each sex of both backgrounds were combined.
