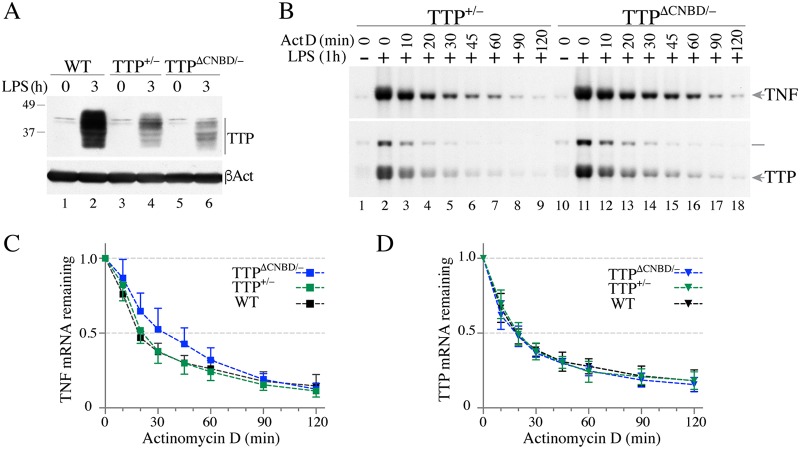
FIG 9.
TTP protein expression and TNF or TTP mRNA decay in TTP+/− and TTPΔCNBD/− BMDM after LPS stimulation. BMDM from WT, TTP+/−, and TTPΔCNBD/− mice were treated with LPS for various times, as indicated. (A) Western blot demonstrating TTP protein expression in cells of the three different genotypes. Top, extracts from cells under control conditions (lanes 1, 3, and 5) and from cells treated with LPS for 3 h (lanes 2, 4, and 6). Bottom, results of blotting gels containing the same extracts with an anti-β-actin antibody (βAct). (B) Representative Northern blots showing TNF (top) and TTP (bottom) mRNA decay after ActD treatment. BMDM were stimulated with LPS for 1 h, followed by an ActD decay time course assay. Total RNA samples from TTP+/− cells were loaded into lanes 1 to 9, and total RNA samples from TTPΔCNBD/− cells were loaded into lanes 10 to 18. Migration positions of TNF and TTP mRNA are indicated on the right, and a line at the right of the bottom panel indicates the migration position of a TTP-neo fusion mRNA from the TTP null allele. (C and D) Decay curves (mean values ± SD) from five independent experiments of the type shown in panel B are shown for TNF mRNA decay (C) and TTP mRNA decay (D). As in the experiment described for panel B, cells were stimulated with LPS for 1 h, followed by ActD treatment of WT, TTP+/−, and TTPΔCNBD/− cells, as indicated.

