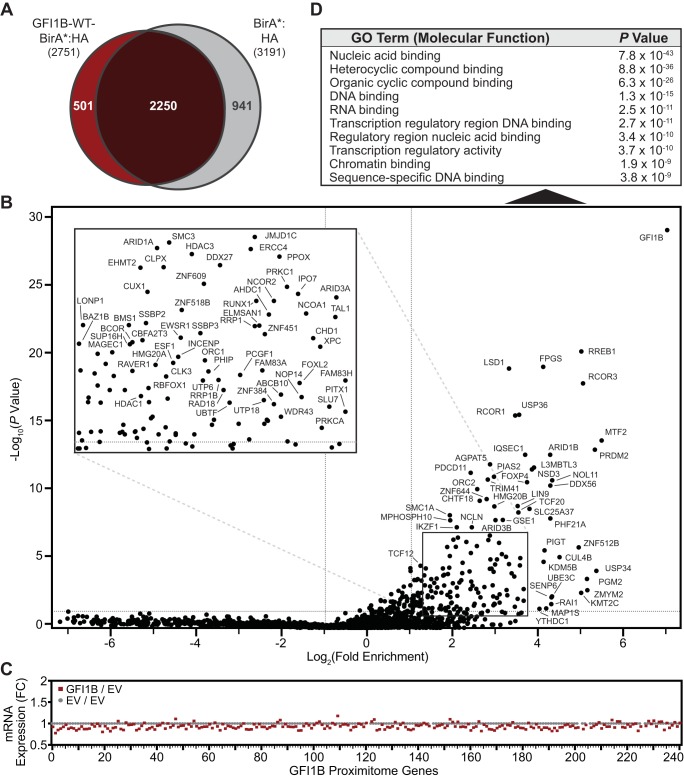
FIG 4.
GFIB-WT-BirA*:HA defines a GFI1B-WT proximitome. (A) Venn diagram showing proteins identified from mass spectral screening of biotin-modified proteins from K562 cells expressing GFI1B-WT-BirA*:HA or BirA*:HA. Common and unique proteins are indicated. (B) GFI1B-WT-BirA*:HA identifies members of a GFI1B-WT proximitome. Factors enriched among biotinylated and SAv-Sepharose-purified proteins modified by GFI1-WT-BirA*:HA (test) compared to BirA*:HA (control) are shown. Fold enrichment is plotted logarithmically as a ratio of average sum read intensities between test and control samples against their P values calculated from their 20 closest-ranked neighbors in the data set as described in Materials and Methods. Individual proteins are labeled with their respective gene names. The inset shows an expanded view of the data contained in the boxed area. (C) Fold change in mRNA levels for the 241 hits identified in the GFI1B-WT proximitome. mRNAs for each hit are listed in rank order from highest to lowest to match their order in the GFI1B-WT proximitome, also from highest to lowest. (D) Gene ontology (GO) analysis for the 241 hits identified in the GFI1B-WT proximitome. The top 10 functional assignment are shown with their corresponding P values.

