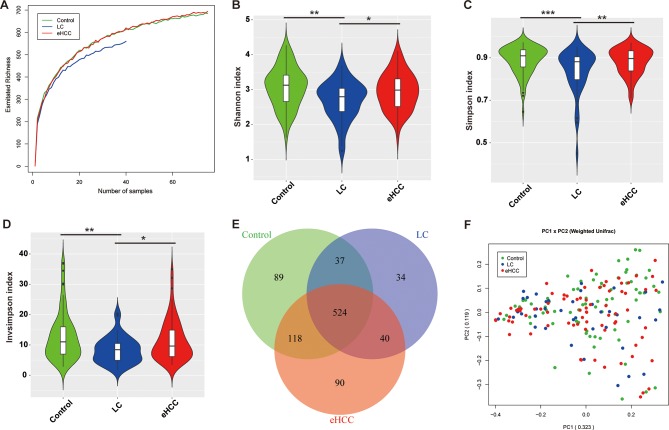
Figure 2.
Increased faecal microbial diversity in patients with eHCC (n=75) versus patients with cirrhosis (n=40). (A) Shannon-Wiener curves between number of samples and estimated richness. The estimated OTUs richness basically approached saturation in all samples. Compared with the controls, faecal microbial diversity, as estimated by the Shannon index (B), Simpson index (C) and Invsimpson index (D), was significantly decreased in patients with liver cirrhosis (p=0.0011, 0.0007 and 0.0007, respectively). In contrast, microbial diversity was markedly increased in patients with eHCC versus patients with liver cirrhosis (p=0.0234, 0.0068 and 0.0068, respectively). (E) A Venn diagram displaying the overlaps between groups showed that 524 of the total richness of 932 OTUs were shared among the three groups, while 564 of 843 OTUs were shared between cirrhosis and eHCC. (F) Beta diversity was calculated using weighted UniFrac by PCoA, indicating a symmetrical distribution of faecal microbial community among all the samples. eHCC, early HCC; HCC, hepatocellular carcinoma; LC, liver cirrhosis; OTUs, Operational Taxonomy Units; PCoA, principal coordinates analysis.

