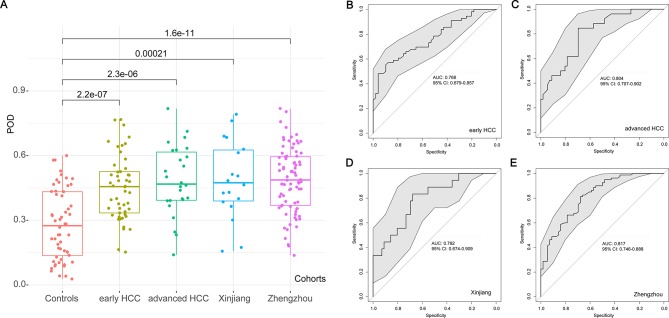
Figure 5.
Validation and independent diagnosis of microbial markers for HCC. (A) Each POD of each participant from the different cohorts was calculated and the average POD values were compared between the controls and the other HCC cohorts in the validation phase and the independent diagnosis phase. (B) The POD achieved an AUC value of 76.80% (95% CI 67.90% to 85.70%) between early HCC and controls in the validation phase. (C) The POD achieved an AUC value of 80.40% (95% CI 70.70% to 90.20%) between the advanced HCC and controls in the validation phase. (D) The POD achieved an AUC value of 79.20% (95% CI 67.40% to 90.90%) between the 18 HCC from Xinjiang and controls in the independent diagnosis phase. (E) The POD achieved an AUC value of 81.70% (95% CI 74.60% to 88.80%) between the 80 HCC from Zhengzhou and controls in the independent diagnosis phase. AUC, area under the curve; HCC, hepatocellular carcinoma; POD, probability of disease.

