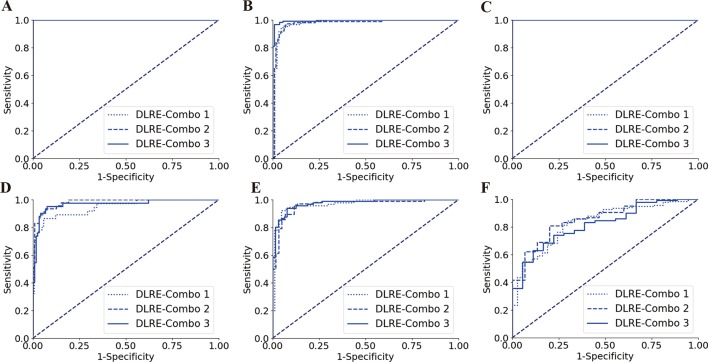
Figure 5.
Comparison of receiver operating characteristic (ROC) curves between different combinations of hospitals for training deep learning Radiomics of elastography (DLRE) in the classification of liver fibrosis stages. (A, D) F0-F3 versus F4 (F4) in training (combination of hospitals B, D, G, E, H and J) and validation cohorts. (B, E) F0-F2 versus F3-F4 (≥F3) in training (combination of hospitals A, C and K) and validation cohorts. (C, F) F0-F1 versus F2-F4 (≥F2) in training (combination of hospitals A, G and K) and validation cohorts. Note: three ROC curves completely overlap each other in (A) and (C), as they all reach the optimal profile (area under the receiver operating characteristic curve (AUC)=1).

