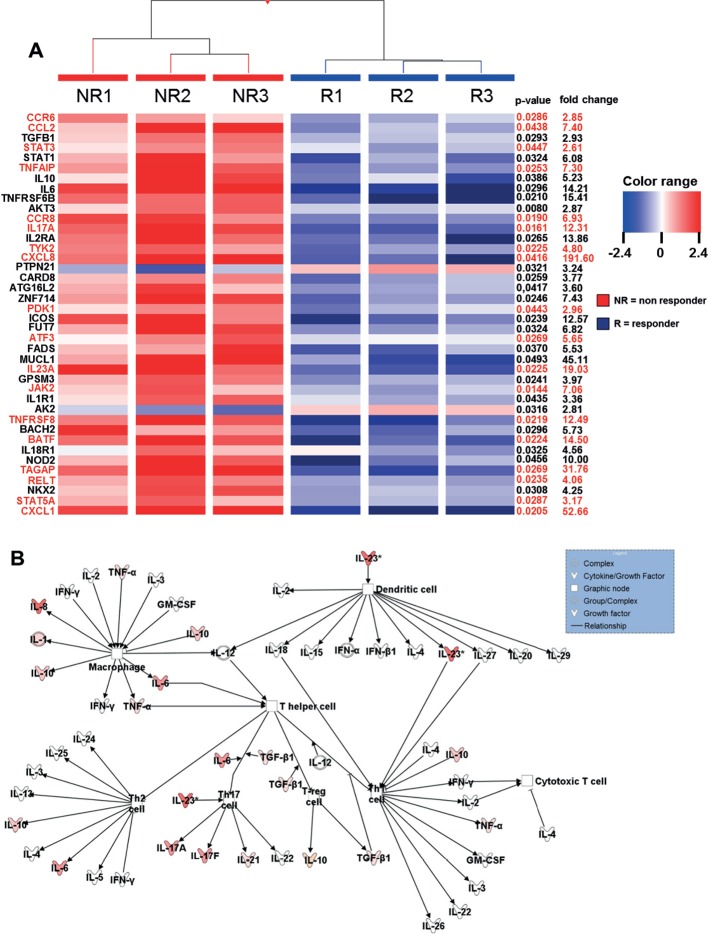
Figure 2.
Heatmap of genes showing microarray based differential expression of IBD susceptibility and IL23R associated pathway genes during ongoing anti- TNF therapy (A) Gene expression profiles of isolated LPMCs from responders (n=3) and non-responders (n=3) to anti-TNF therapy in CD patients. Shown as a heat map are expression patterns of 40 IBD susceptibility genes and some genes which are additionally involved in IL23R signaling (in red) from microarray data, with the corresponding hierarchical clustering of the experimental conditions (responder or non-responder to anti-TNF therapy in CD patients). Results were corrected for multiple testing with the Benjamini-Hochberg correction. Pearson and Ward were used to compute hierarchical clustering of the experimental conditions. Expression data for each gene/row were normalized to the median expression value of the respective gene across all six samples. (B) Ingenuity Pathway Analysis of CD anti-TNF responders and non-responders during ongoing anti-TNF therapy showing the role of cytokines mediating communication between immune cells. The intensity of the color indicates the level of upregulation (red) or downregulation (green) of the respective cytokines in anti-TNF non-responders compared to anti-TNF responders.

