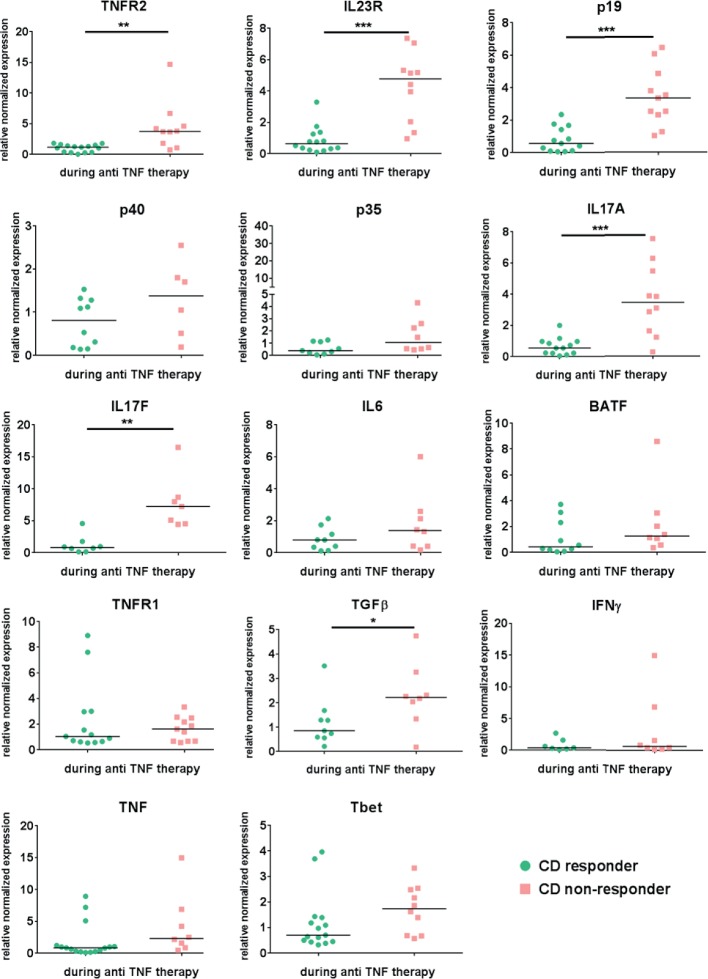
Figure 3.
Mucosal expression level of several cytokines, cytokine receptors and cytokine-inducing transcription factors in Crohn’s disease patients during ongoing anti-TNF therapy Mucosal biopsies were taken from the same CD patient prior and during initiated anti- TNF. Response to anti-TNF therapy was defined as a SES-CD <5 during the endoscopic examination where the biopsy was taken under ongoing anti-TNF treatment. Quantitative RT-PCR analysis of the intestinal biopsies from responders (n=7-16) and non-responders (n=6-11) was performed. Data were normalized to the housekeeping-gene Hprt and compared to the respective expression level prior to the initiation of anti-TNF therapy in each single patient. Gene expression is shown as fold induction. Every symbol represents a single patient. Median value is indicated as a line *P≤0.05.; **P≤0.01, ***P≤0.001.

