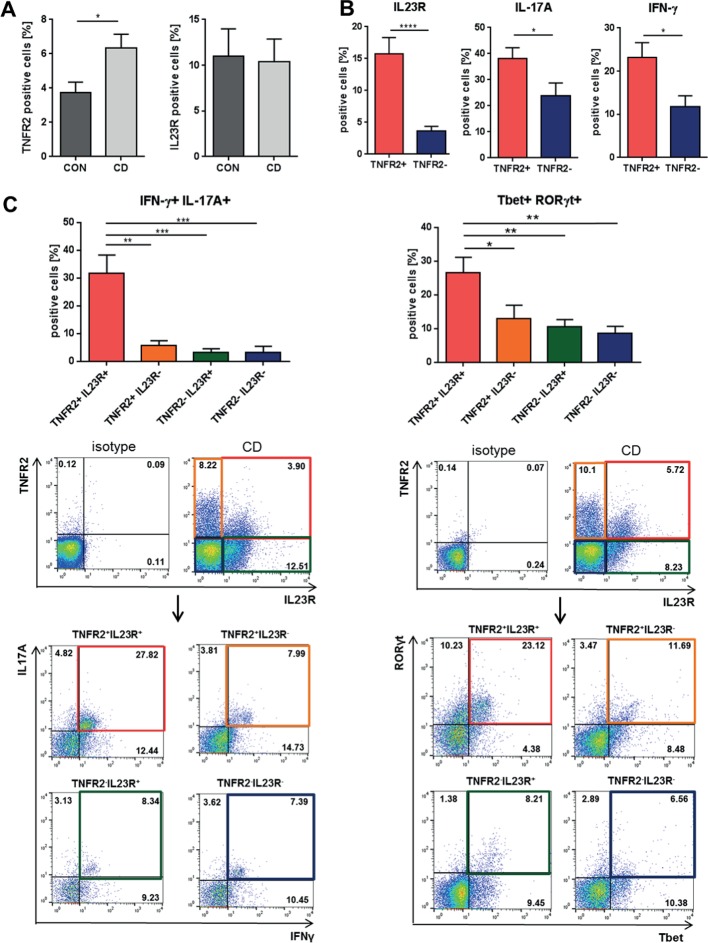
Figure 4.
Molecular characterisation of mucosal TNFR2+IL23R+ cells in patients with Crohn’s disease (CD). (A) Flow cytometric analysis of TNFR2 and IL23R cell expression in lamina propria mononuclear cells from intestinal tissue of control patients (CON; n=7) and patients with CD with active mucosal inflammation (CD; n=9–14). (B) Quantitative expression analysis of IL23R, IFN-γ and IL-17A in TNFR2+ and TNFR2− intestinal cells from patients with CD (n=22–33). Isolated mucosal cells were analysed by flow cytometry using a lymphocyte gate. (C) Flow cytometric expression analysis of intestinal cells from patients with CD, which express IFN-γ+IL17-A+ or Tbet+RORγt+ cells within T cells that showed expression of either TNFR2, IL23R, both or none of these receptors (n=9–10). Representative FACS plots of the analyses of the above-described expression profiles of intestinal cells from patients with CD are shown. Data represent mean values±SEM. *p≤0.05; **p≤0.01; ***p≤0.001.

