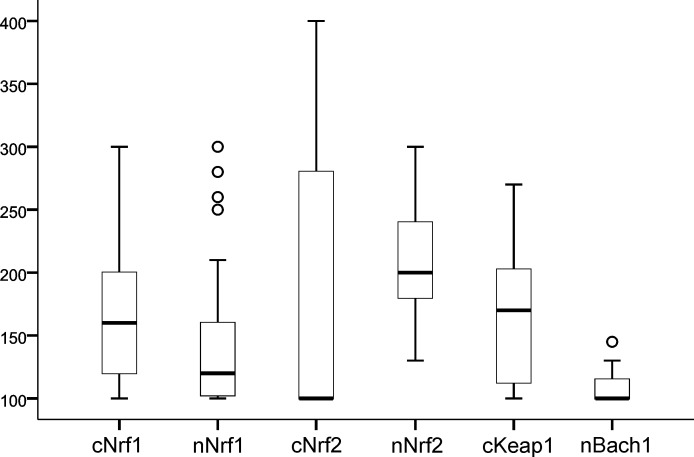
Figure 1.
Histoscore results of patients by distribution. Ranges are 100–300 and 100–400 (cNrf2 and nBach1), where 100 means negative staining. Bach1, CNC homolog 1; c, cytoplasmic; Keap1, Kelch ECH associating protein 1; n, nuclear; Nrf1, nuclear factor erythroid 2-related factor 1; Nrf2, nuclear factor erythroid 2-related factor 2.

