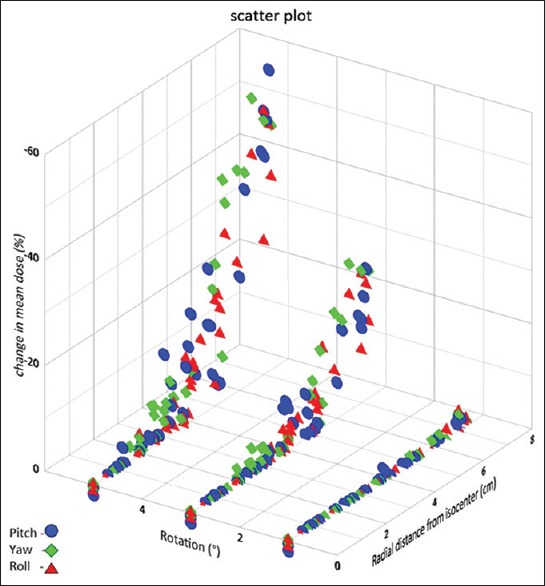
Figure 6.

Change in mean dose values plotted as a function of radial distance from the rotational axis through isocenter for various rotational errors

Change in mean dose values plotted as a function of radial distance from the rotational axis through isocenter for various rotational errors