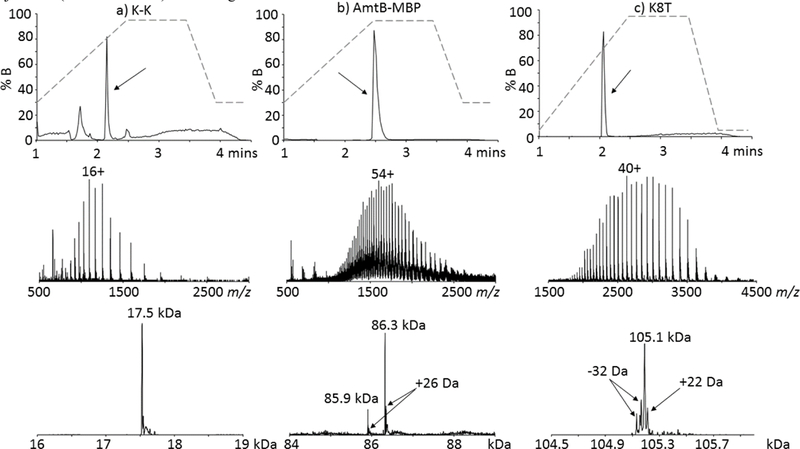
Figure 1.

Representative reconstructed UPLC ion chromatograms (RICs) (upper), MS spectra (middle) and deconvoluted MS spectra (lower) of the membrane proteins (a) K-K (~17.5 kDa); (b) AmtB-MBP (~86.3 kDa) and (c) Fc-provided antibody construct K8T (~105.1 kDa). The black arrow in each chromatogram denotes where the protein elutes from the polyphenol column. The Y-axis for each chromatogram is the % B gradient profile (dashed line), starting at 30% B for the membrane protein samples and at 5% B for the bispecific antibody constructs. The most intense charge state is labeled in each MS spectrum. The 85.9 kDa species observed for AmtB-MBP corresponds to an N-terminal clip, vide infra. The +26 Da and +22 Da species present in the deconvoluted spectra for AmtB-MBP and K8T are presumably salt adducts. The Y-axis for the spectra represents intensity with arbitrary units.
