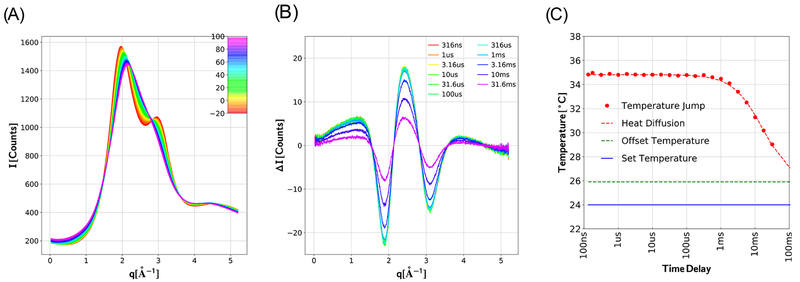
Figure 2.
Temperature-dependent SAXS/WAXS patterns are used to deduce the time-dependent temperature following a T-jump. (A) Temperature-dependent scattering patterns were acquired from aqueous buffer (150 mM NaCl, 20 mM acetate buffer, pH 4.9) over a broad range of q according to a T-ramp data acquisition protocol (see text). The intensity is reported in units of counts per pixel from a single image, with the color-coded curves representing the average of at least 6 images for each temperature. (B) Time-dependent scattering differences acquired following a 9 °C T-jump with the temperature controller set point programmed for 24 °C. ΔI corresponds to (It – I−10 μs), where I−10 μs represents the scattering pattern recorded with the X-ray pulse arriving 10 μs before the laser heating pulse. The amplitude of the scattering difference decreases at longer time delays as heat diffuses beyond the volume illuminated by the laser heating pulse. (C) Time-dependence of the buffer temperature within the volume probed by the X-ray beam following a 9 °C T-jump, as determined by using the curves in part A as a calibrated molecular thermometer. The temperature stability in the plateau region (t < 316 μs) was found to be 0.06 °C rms, which quantifies the precision of this “molecular thermometer.” The dashed red line corresponds to a 2-dimensional Gaussian diffusion model for thermal cooling at the laser beam center: T(t) ∝ [2π(2Dt + σL2)]−1 where D is the diffusion constant and σL is laser spot size. The solid blue line corresponds to the temperature controller set point; the dashed green line corresponds to the solution temperature prior to the T-jump. Note that repetitive heating of solution in the sample capillary during T-jump measurements elevates its mean temperature about 2 °C relative to the temperature controller set point.

