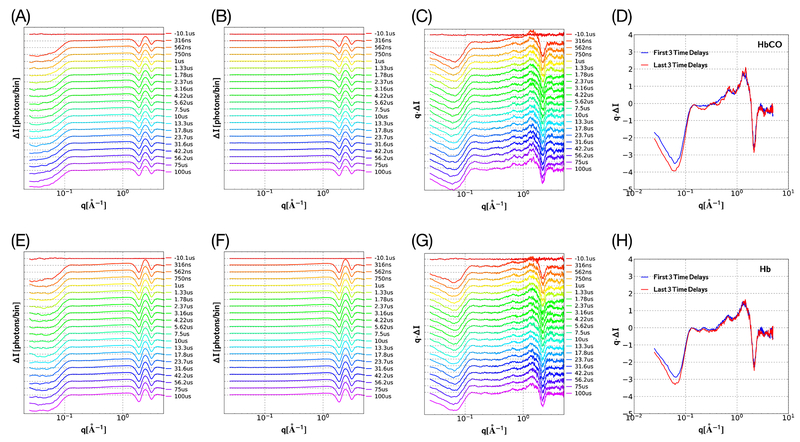
Figure 4.
Time-resolved SAXS/WAXS differences spanning 316 ns to 100 μs (8 time points per decade) following a T-jump; ΔI corresponds to (It – I−10 μs). (A) HbCO solution (22 °C set point; 1.3 °C offset; 13.5 °C T-jump). (B) Buffer under identical experimental conditions. (C) HbCO solution minus buffer. (D) Average scattering for the first three (blue) and last three (red) curves in the time series shown in part C. (E−H) Same as parts A−D but for Hb solution. Note the vertical axes in parts C, D, G, and H correspond to q·ΔI, not ΔI, which facilitates visualization of both SAXS and WAXS regions on the same linear scale. Over the range 0.1 < q < 1.0, the short- and long-time scattering patterns for HbCO (D) differ significantly, whereas the corresponding patterns for Hb (H) are very similar.

