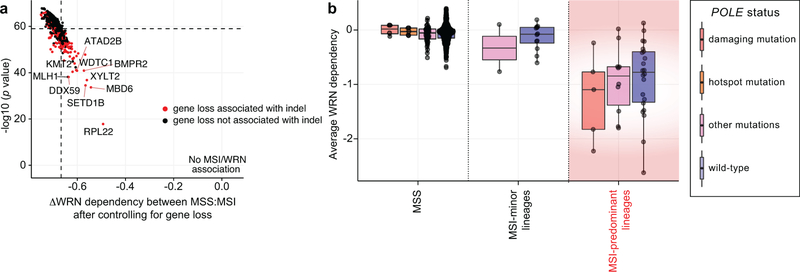
Extended Data Fig. 9. Paralog dependencies and hypermutation alone cannot explain the WRN/MSI relationship.
a, Estimated association between WRN dependency and MSI status after controlling for loss of indicated genes (linear model effect size estimates plotted against significance). If loss of a gene can fully account for the MSI/WRN relationship, the difference in dependency and significance would be 0. Genes whose loss are typically associated with insertion/deletion (indel) mutations (> half of loss events) are highlighted in red. n = 51 MSI, 541 MSS. b, Average WRN dependency score for MSS and MSI lines stratified by POLE status (n = 4, 5, 35, 497, 2, 12, 5, 10, 22 cell lines per category in order of left to right). Lower and upper hinges: 25th and 75th percentiles, respectively. Lower and upper whiskers: lowest and largest value within 1.5*IQR (inter-quartile range) from the hinge, respectively.

