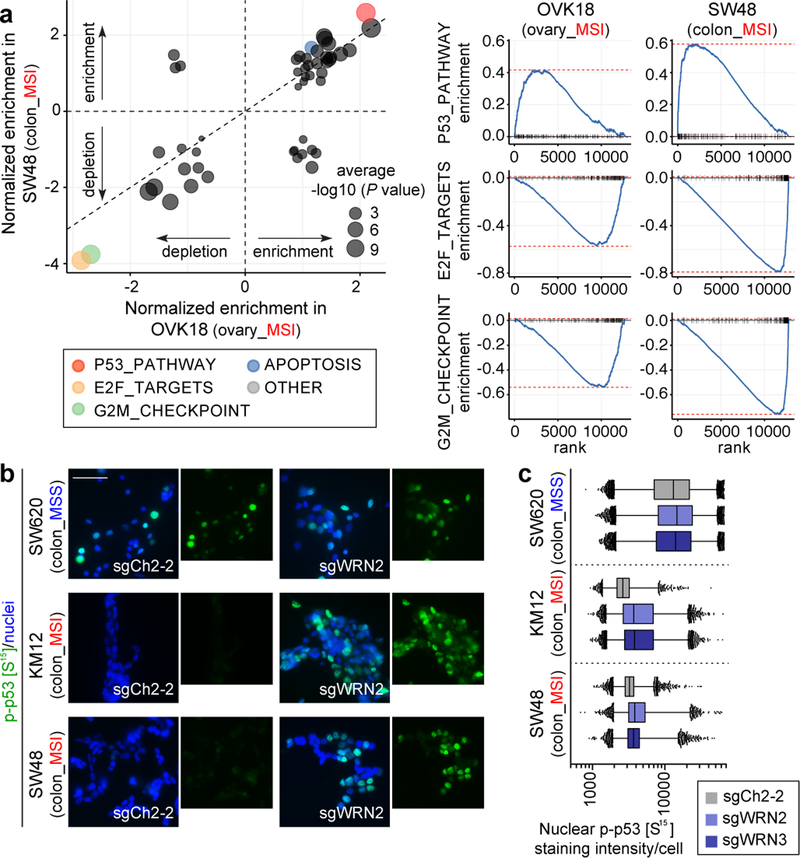
Fig. 3. WRN depletion in MSI cells induces cell cycle arrest, apoptosis, and a p53 response.
a, GSEA enrichment/depletion scores in WRN-depleted OVK18 cells plotted against WRN-depleted SW48 cells. Signature enrichment plots for Hallmark gene sets shown for WRN-depleted OVK18 and SW48 cells. n = 2 biological replicates. b, phospho-p53 (S15) immunofluorescence (IF) following sgRNA transduction (50 µm scale bar). c, Nuclear phospho-p53 (S15) staining intensity per cell. Lower error bar, box lower limit, bar, box upper limit, upper error bar, dots: 1st, 25th percentiles, median, 75th, 99th percentiles, outliers, respectively. Mean log intensity change following WRN knockout compared to control sgRNA in MSI versus MSS cells; P < 2×10⁻¹⁶, contrast test of least-squares means. Mean log-fold change: 0.21 (KM12), 0.10 (SW48), 0.034 (SW620). n = (# cells with sgCh2–2, sgWRN2, sgWRN3) for KM12 (7080, 14410, 15921), SW48 (15329, 9491,13196), SW620 (27374, 23898, 28808). For Fig. 3, representative data from one experiment are shown. All experiments were performed twice except for a (once).

