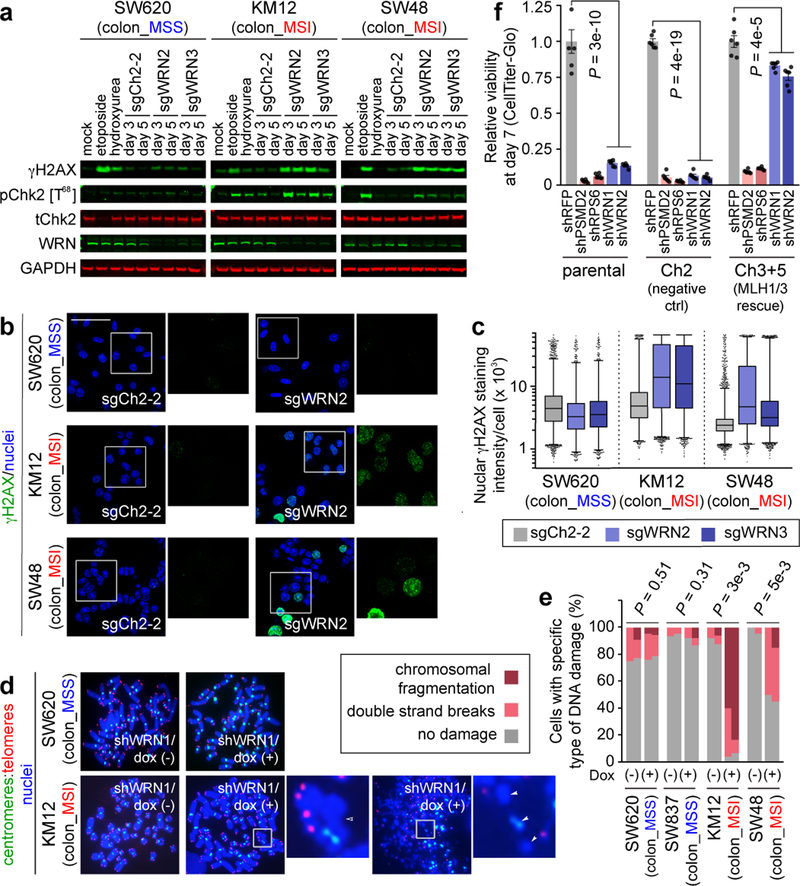
Fig. 4. WRN depletion in MSI cells leads to accumulation of double strand DNA breaks.
a, IB. ɣH2AX, phospho(T86)- and total- Chk2, WRN, GAPDH levels following WRN knockout. Etoposide and hydroxyurea were used to generate DSB and replication stress, respectively. b, ɣH2AX IF following sgRNA transduction (50 µm scale bar). c, Nuclear ɣH2AX staining intensity per cell. Lower error bar, box lower limit, bar, box upper limit, upper error bar, dots: 1st, 25th percentiles, median, 75th, 99th percentiles, outliers, respectively. Mean log intensity change following WRN knockout compared to control in MSI compared with MSS cells; P < 2×10⁻¹⁶, contrast test of least-squares means. Mean log fold-change: 0.39 (KM12), 0.33 (SW48), −0.10 (SW620). n = (cells with sgCh2–2, sgWRN2, sgWRN3) for KM12 (3029, 8880, 6887), SW48 (13246, 4553, 7216), SW620 (9071, 5174, 3853). d, Telomere PNA-FISH of metaphase spreads ± dox-induction of shWRN1. Hollow triangles: chromosomal breaks. Filled triangles: chromosomal fragments. e, Metaphase spread DNA damage pattern per cell. n = 2 independent experiments presented in tandem. f, Relative viability of HCT116 ± MMR restoration 7 days following shRNA transduction. Negative control: shRFP. Pan-essential controls: shPSMD2, shRPS6. WRN shRNA: shWRN1, shWRN2. Data shown: means ± SEM (n = 6 biological replicates). P values: two-tailed t-test for % cells with DNA damage (e), two-way ANOVA between shWRNs and shRFP (f). For a–d, f, representative data from one experiment are shown. For e, data from two independent experiments are shown. All experiments were performed twice.

