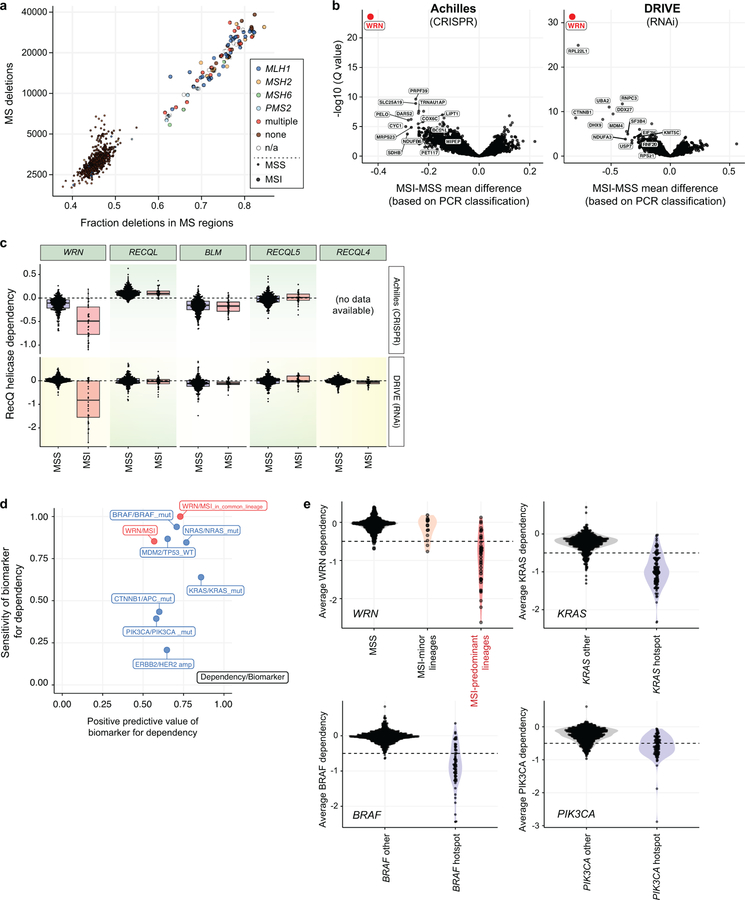
Extended Data Fig. 1. Functional genomic screening identifies WRN as a selective dependency with MSI.
a, Screened cell lines plotted by number of deletions and fraction of deletions occurring in microsatellite (MS) regions. Loss of genes involved in MMR are indicated by color. b, Using PCR-based MSI phenotyping, the FDR-adjusted Q values (Benjamini–Hochberg procedure) were plotted against the mean difference of dependency scores between MSI and MSS cell lines for Projects Achilles (n = 19 MSI, 291 MSS) and Project DRIVE (n = 23 MSI, 252 MSS). c, Dependency scores for each RecQ helicase plotted for MSI and MSS cell lines from Projects Achilles and DRIVE (n = as per b). Q values (Wilcoxon rank-sum test) for Achilles/DRIVE = 5.0×10⁻⁸/1.7×10−8; 0.73/0.52; 0.73/0.85; 0.25/0.73; 0.08/NA for WRN, REQL, BLM, RECQL5, and RECQL4, respectively. Lower, upper hinges: 25th, 75th percentiles, respectively. Lower, upper whiskers: lowest, largest value within 1.5*IQR (inter-quartile range) from the hinge, respectively. d, Sensitivity and positive predictive value of indicated biomarker/genetic dependency relationship. e, Dependency score distributions and associated biomarkers for example biomarker/dependency relationships. Colored regions represent density estimates. Horizontal dashed line: threshold used to separate dependent and non-dependent cell lines. n = 120/546 KRAS hotspot mutants/other; 65/601 BRAF hotspot mutants/other; 86/580 PIK3CA hotspot mutants/other.

