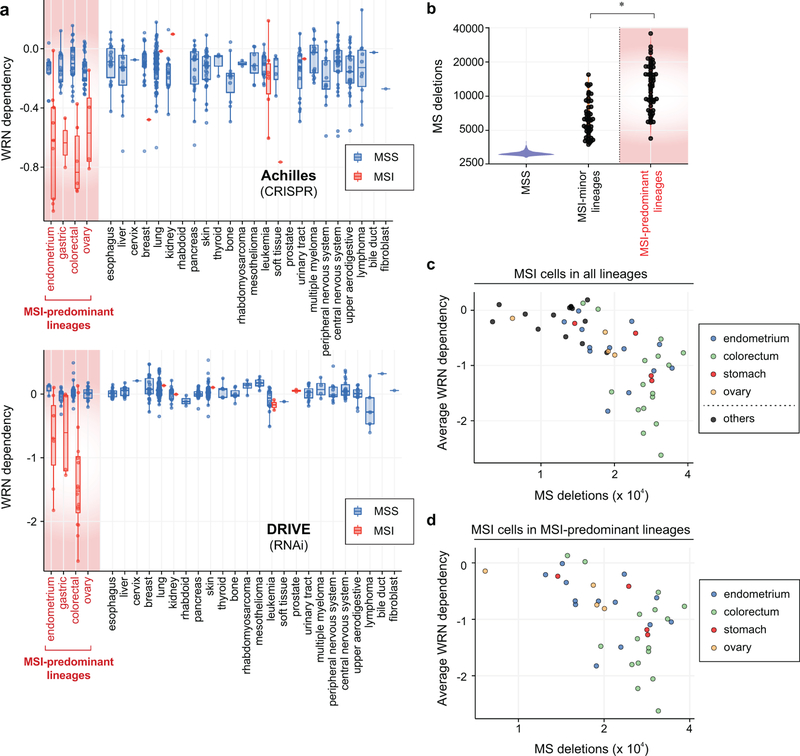
Extended Data Fig. 2. MSI cells from MSI-predominant lineages possess greater mutational burden and WRN dependency.
a, WRN dependency scores plotted by lineage, sub-classified by MSI and MSS status. Lower, upper hinges: 25th, 75th percentiles, respectively. Lower, upper whiskers: lowest, largest value within 1.5*IQR (inter-quartile range) from the hinge, respectively. b, MS deletions in cell lines classified as MSS (n = 541), MSI from an infrequent MSI lineage (n = 45), or MSI from an MSI-predominant lineage (n = 54). P value = 1.7×10⁻⁹ (*), Wilcoxon signed-rank test. Lower and upper hinges: 25th and 75th percentiles, respectively. Lower, upper whiskers: lowest and largest value within 1.5*IQR (inter-quartile range) from the hinge, respectively. c, MSI cell lines plotted by their average WRN dependency and number of MS deletions. Lineages are color-labeled. d, MSI cell lines from MSI-predominant lineages are plotted by their average WRN dependency and number of MS deletions. Lineages are color-labeled.

