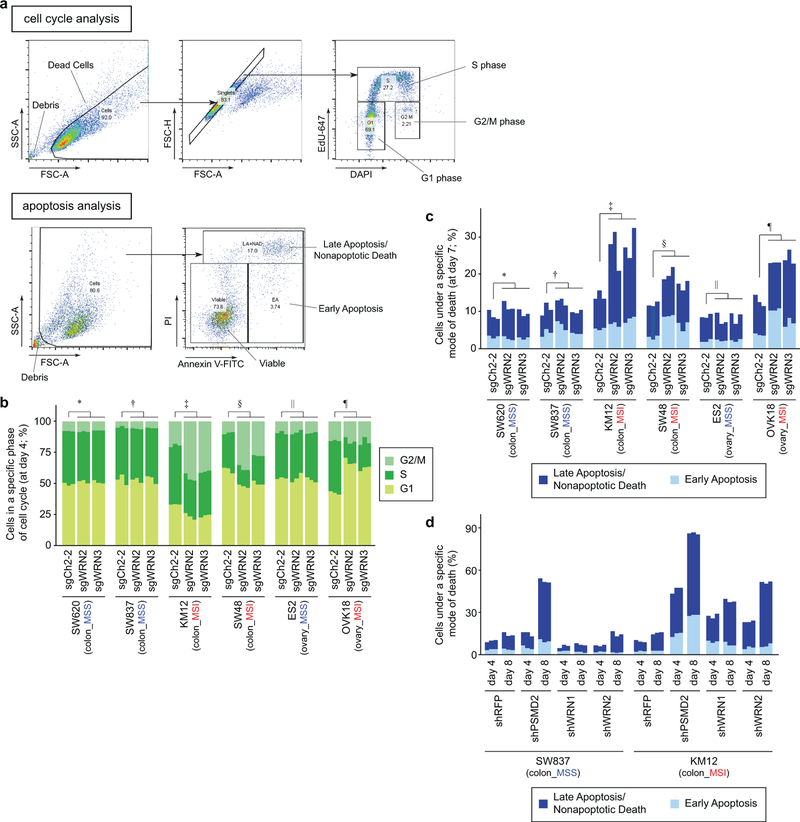
Extended Data Fig. 4. WRN depletion preferentially induces cell cycle arrest and apoptosis in MSI cells.
a, Gating strategy. For cell cycle analyses (top), debris and dead cells were excluded based on forward scatter-area (FSC-A) and side scatter-area (SSC-A) profiles. Subsequently, singlets were identified based on FSC-A and forward scatter-height (FSC-H) profiles. These singlets were then analyzed for DAPI (DNA content) and EdU-Alexa Fluor 647 (EdU-647) staining intensities. EdU-647-positive cells (cells exhibiting higher staining intensity than unstained cells) were classified as ‘S-phase’. EdU647-negative cells were classified either as ‘G1-phase’ or ‘G2/M-phase’ based on their DNA content. For apoptosis analyses (bottom), debris were excluded based on FSC-A and SSC-A profiles. The remaining samples were analyzed for Annexin V-FITC and propidium iodide (PI) staining intensities. Subsequently, Annexin V-FITC-positive cells and PI-positive cells (cells exhibiting higher staining intensity than unstained cells) were identified. Based on the positivity of these markers, cells were classified into either of the following three categories: Viable (Annexin V-negative, PI-negative), Early Apoptosis (Annexin V-positive, PI-negative), and Late Apoptosis/Nonapoptotic death (PI-positive). b, Cell cycle evaluation 4 days after sgRNA transduction. P values (two-way ANOVA) comparing sgCh2–2 vs sgWRNs for % S-phase cells: 0.16 (∗), 0.67 (†), 6.1×10⁻⁷ (‡), 3.5×10⁻⁴ (§) 0.69 (||), 2.6×10⁻⁶ (¶). c, Annexin V/propidium iodide (PI) staining evaluating early apoptosis and late apoptosis/non-apoptotic cell death 7 days following sgRNA transduction. P values (two-way ANOVA between sgCh2–2 and sgWRNs for % dying/dead cells): 0.10 (∗), 0.41 (†), 3.4×10⁻³ (‡); 3.6×10⁻⁴ (§), 0.57 (||), 3.6×10⁻⁵ (¶). d, Annexin V/PI staining 4 and 8 days following shRNA transduction. P values (two-way ANOVA comparing shRFP and shWRNs): 1.3×10⁻³ (SW837 day 4), 1.6×10⁻² (SW837 day 8), 1.2×10⁻⁶ (KM12 day 4), 4.3×10⁻⁹ (KM12 day 8). Three biological replicates are presented in tandem for b, c, d. For Extended Data Fig. 4, representative data from one experiment are shown. All experiments were performed twice.

