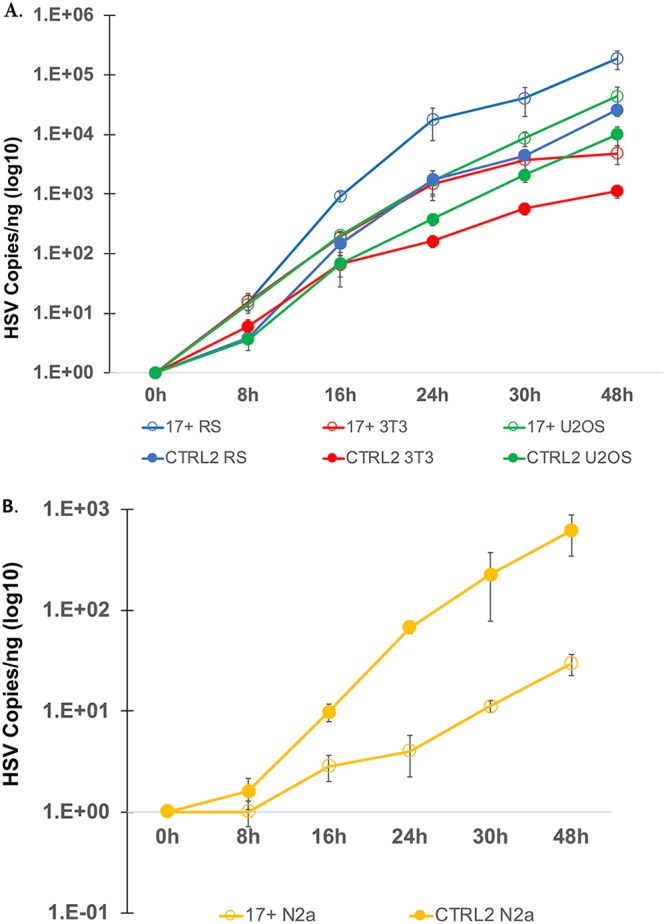
FIG 2.

HSV-1 growth curves in cell culture. (A) Growth curves were done using RS, mouse 3T3, and human U2OS cells as epithelial cell models. Cells were plated at 150,000 cells per well and infected at an MOI of 0.01 with either wild-type 17syn+ or the ΔCTRL2 recombinant. Cells were harvested at the times indicated on the x axis, DNA was extracted, and qPCR was done to measure the HSV-1 DNA polymerase gene, which was quantified using a standard curve generated from purified 17syn+. The ΔCTRL2 recombinant had a replication defect in all epithelial cells used in the quantification. (B) Growth curves using the Neuro 2A (N2a) cell line were done as described above. No replication defect was observed for the ΔCTRL2 recombinant in Neuro 2A cells.
